Bring monitoring evidence and vSphere expertise into the same investigation.
The alert arrives: an application is slow. Now comes the work that consumes an administrator’s morning: finding the affected VMs, comparing performance trends, checking infrastructure changes and deciding what to do next.
Combining Opvizor monitoring, its Model Context Protocol (MCP) integration and the govc skill for Claude Code offers a practical way to shorten that journey. Monitoring supplies the evidence. MCP makes it accessible to an AI assistant. The skill teaches Claude how to investigate vSphere through an established command-line tool.
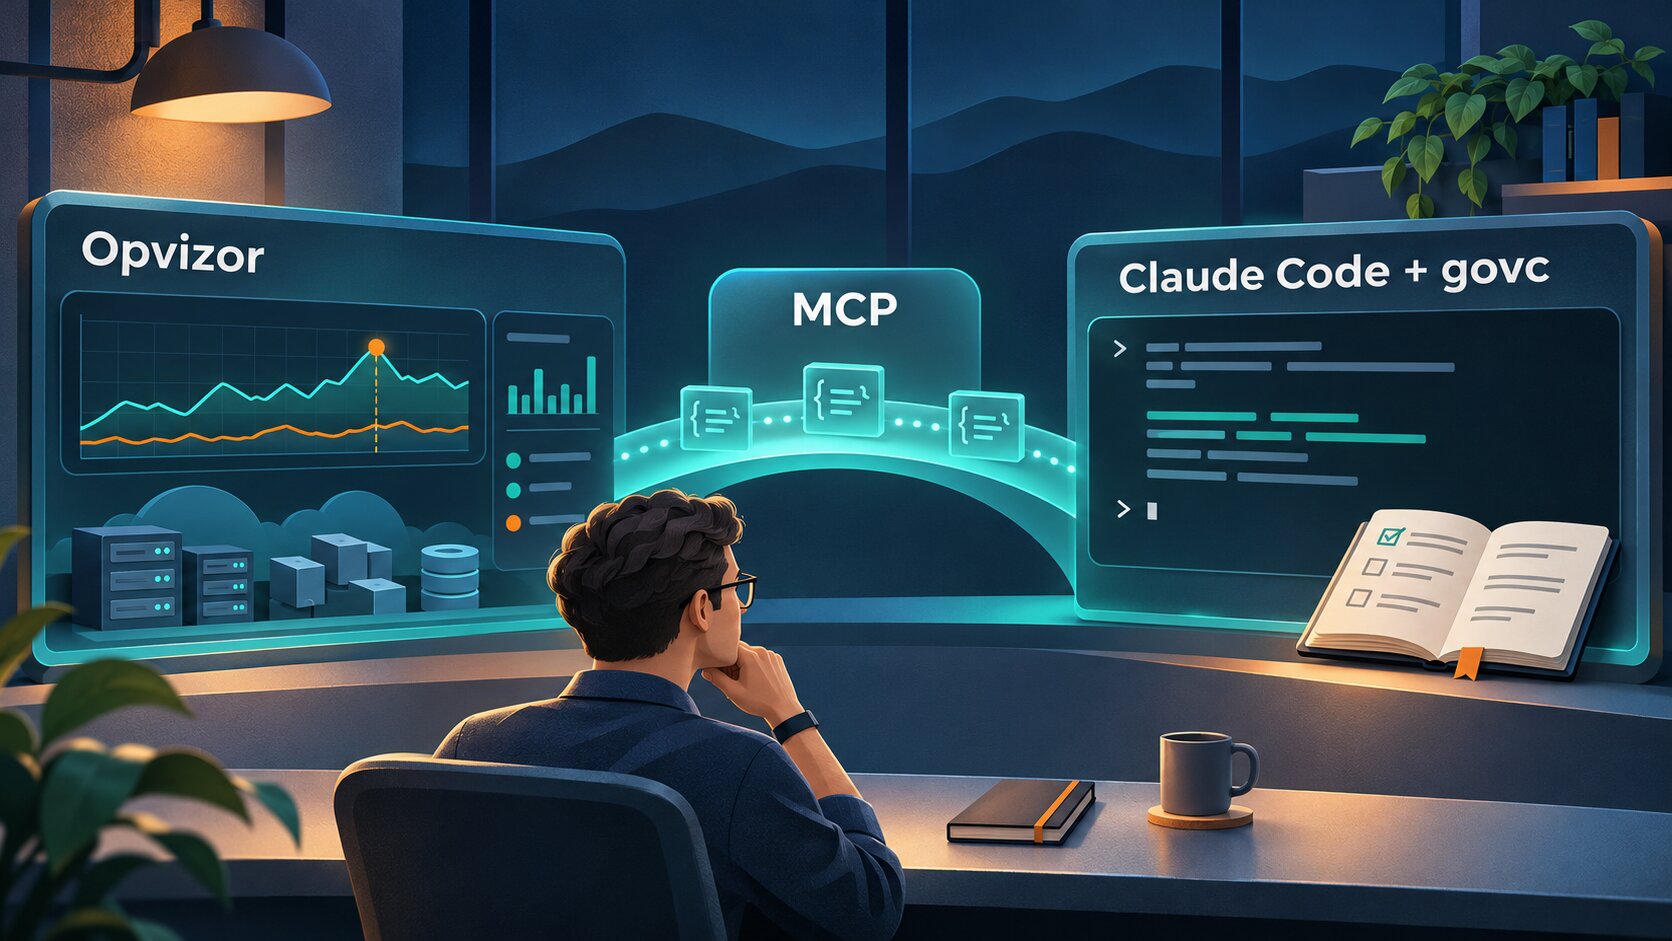
Three complementary components: monitoring context, an AI connection and a vSphere investigation workflow. Conceptual illustration.
What each component contributes#
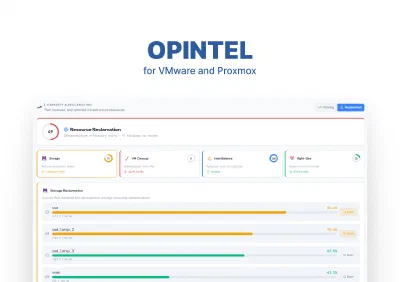
Opvizor brings performance metrics, logs, configuration information and events together across virtual and cloud infrastructure. Its dashboards and historical data help administrators spot bottlenecks and understand how resource use changes over time. This provides the wider operational picture that a single inventory query cannot supply. Explore Opvizor monitoring.
The Opvizor MCP integration connects monitoring streams to AI copilots, including Claude Desktop and ChatGPT. In a combined workflow, that connection lets an assistant work with monitoring context rather than relying on screenshots or manually pasted summaries. Claude Code also supports MCP servers, making it a possible workspace for bringing monitoring tools and local investigation tools together. The available queries depend on the tools exposed by the connected Opvizor server. Opvizor’s MCP overview; Claude Code MCP documentation.
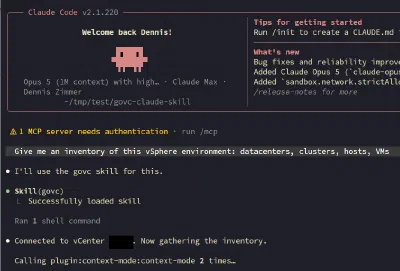
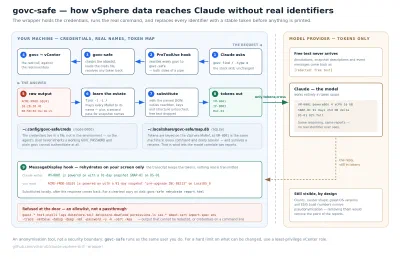
The govc skill adds vSphere-specific working knowledge: how to select commands, query inventory, inspect snapshots, examine events and produce reports. It guides Claude Code’s use of govc against vCenter or ESXi. The skill can operate independently; MCP adds a complementary source of monitoring evidence. Read the govc skill introduction.
| Component | Role in the investigation |
|---|---|
| Opvizor monitoring | Establish the performance trend and affected infrastructure. |
| Opvizor MCP integration | Expose available monitoring context to the assistant. |
| Claude Code + govc skill | Guide targeted vSphere queries and turn findings into a reviewable plan. |
A practical example: investigating datastore latency#
Consider this illustrative workflow, rather than a report of a tested deployment. An application team reports intermittent slowness. Opvizor shows a rise in datastore latency during the same period.
An administrator could ask Claude Code:
Investigate the latency increase using the monitoring data available through Opvizor MCP. Use the govc skill to inspect the affected vSphere objects. Keep the investigation read-only. Summarize the timeline, supporting evidence, alternative explanations and recommended next steps.
First, Claude would use the monitoring tools available through MCP to narrow the time window and scope. Next, the govc skill could guide checks of the relevant VMs, their datastore placement, snapshots and recent events. The administrator should confirm that object identities and timestamps match across both sources.
Suppose the investigation finds an old snapshot on a busy VM sharing the affected datastore. That is a lead to investigate. The report should explain whether the timing supports the hypothesis, what other workloads might be contributing and what evidence remains missing.
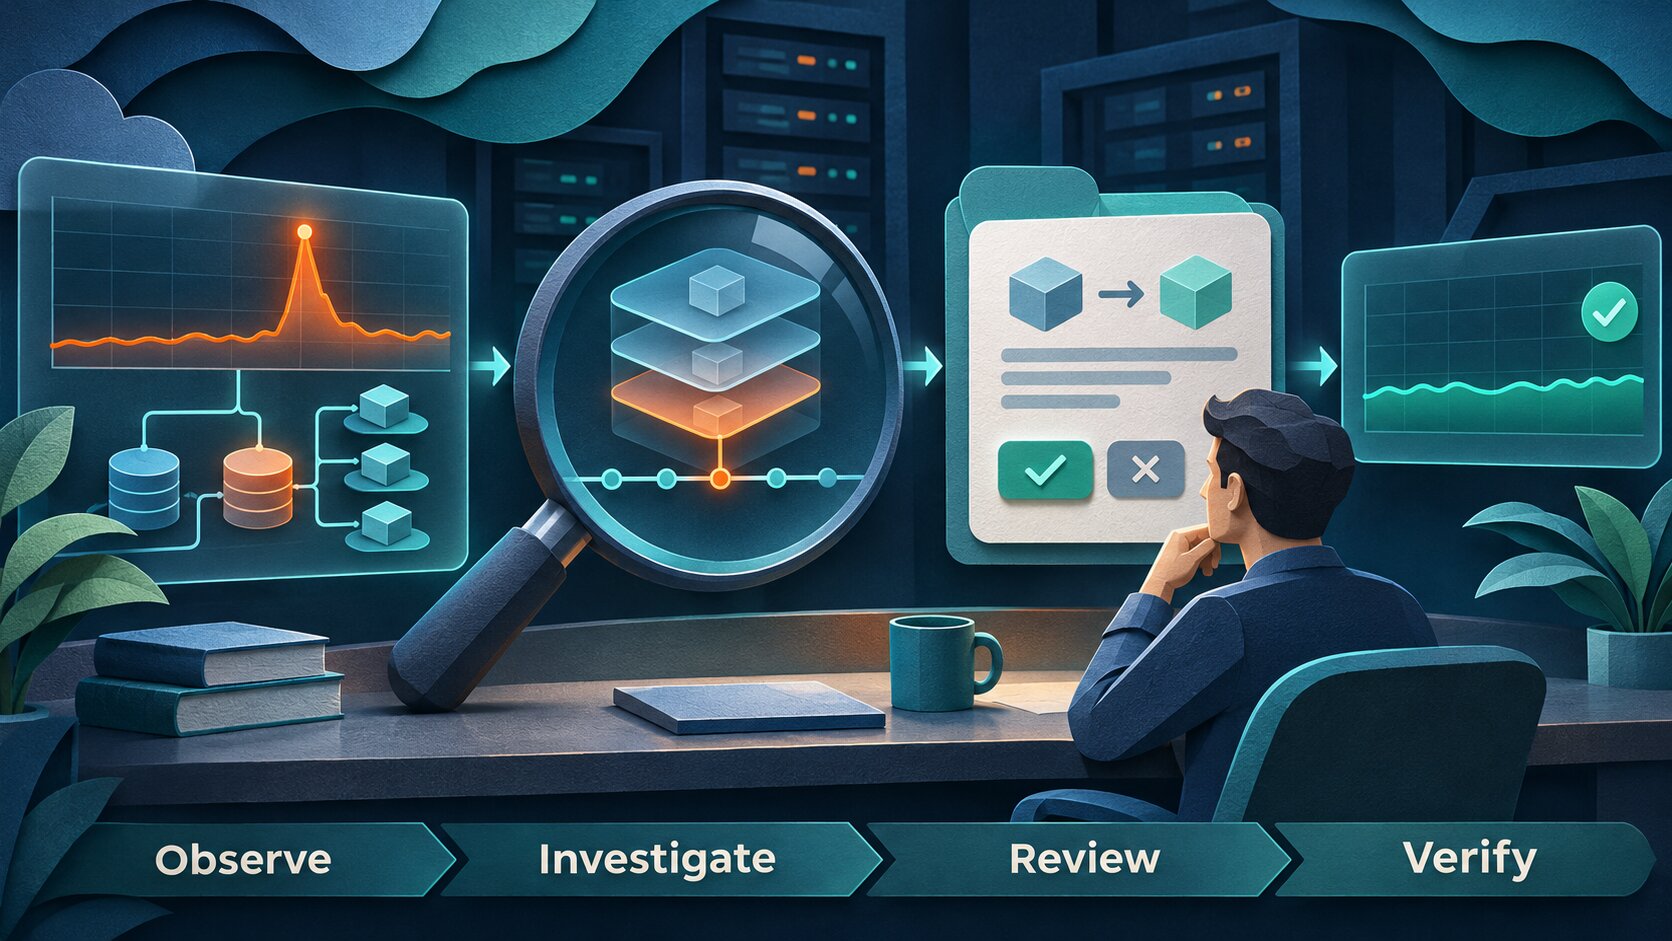
A proposed operating workflow: observe, investigate, review and verify. An anomaly is evidence to examine, not proof of a particular cause.
Make the next step reviewable#
A useful investigation ends with a concrete recommendation: which objects are affected, which checks support the diagnosis, what change is proposed and how success will be measured. After an approved change, return to Opvizor and compare the relevant metrics with the baseline. Check application behavior too.
The govc skill starts with read-only investigation and includes confirmation rules for destructive operations. Its repository also offers an optional command policy hook. Pair those controls with appropriate vCenter permissions; written instructions alone do not enforce access boundaries. See the skill and optional controls.
Start with one repeatable investigation#
Begin with a focused use case, such as datastore pressure or a snapshot audit. Configure the Opvizor MCP connection using the deployment’s supported transport and authentication, install the govc skill and verify read-only vSphere access. Test that Claude can retrieve useful monitoring data and match it to the correct vSphere objects before expanding the workflow.
Opvizor’s vision of a virtual SRE becomes tangible when monitoring evidence feeds an investigation that produces an actionable, reviewable answer. Continuous unattended operation additionally needs scheduling, credentials and an execution environment; an MCP connection alone does not create an always-running operator.
Start with the question your team answers every week. Connect the evidence, teach the investigation workflow and use the resulting report to decide the next step with confidence. Explore Opvizor and the govc skill for Claude Code.