· Dennis
From Alert to Answer: Combining Opvizor, MCP and Claude Code
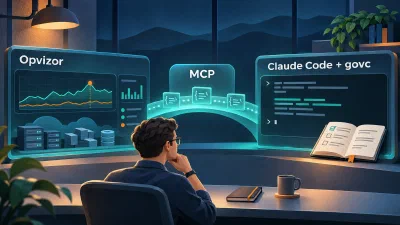
Combine Opvizor monitoring, its MCP integration and the govc skill for Claude Code to move from alert to a reviewable vSphere investigation plan, faster.
Blog
Field notes on VMware vSphere, cloud and container performance, security and monitoring.
· Dennis
Combine Opvizor monitoring, its MCP integration and the govc skill for Claude Code to move from alert to a reviewable vSphere investigation plan, faster.
· Dennis
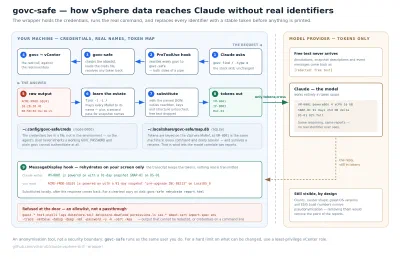
A follow-up to the govc skill for Claude Code, a pseudonymising wrapper that replaces every VM name, IP, MAC and UUID with a stable token before the model ever sees it, and rehydrates them on your screen.
· Dennis
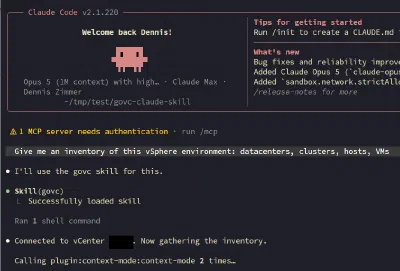
How a Claude Code skill teaches Claude to run govc safely, read-only reporting, snapshot audits, and guardrails before any destructive vSphere command
· Dennis
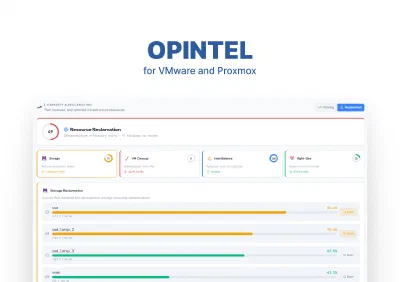
OpIntel unifies VMware (vSphere/ESXi) and Proxmox into one AI-powered console - one health score, capacity forecasting, and automated remediation across both estates.
· Dennis
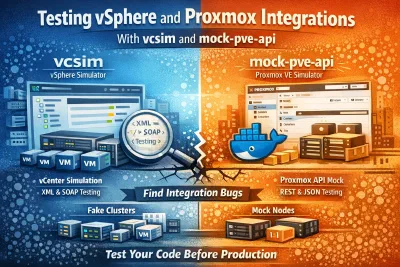
A practical guide to testing vSphere and Proxmox integrations with vcsim and mock-pve-api, setup, real bugs surfaced, and CI integration patterns.
· Dennis
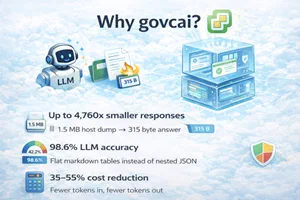
govcai, open source wrapper that makes VMware govc output LLM-ready. Output reduction, risk gates, structured errors, LLM optimized. Drop-in replacement for govc in AI agent workflows.
· Dennis
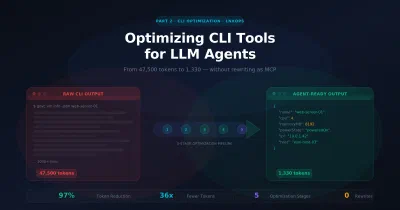
govc dumps 12,000 tokens per call. With 5 optimizations, structured output, field filtering, semantic routing, cut that to 80. No MCP rewrite required.
· Dennis
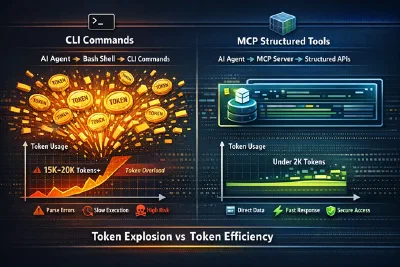
AI agents managing VMware infrastructure waste 10x more tokens with CLI than MCP. See benchmarks, architecture patterns, and how AgentOpvizor solves this.
· Opvizor Team
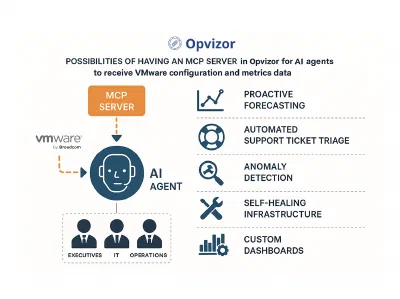
Supercharge Opvizor with MCP server integration for AI-driven automation, forecasting, and self-healing infrastructure in complex IT environments.
· Opvizor Team
Opvizor provides unified real‑time and long‑term historical monitoring of VMs, hosts, storage, and networks in a single dashboard.
· Opvizor Team
Opvizor delivers comprehensive real‑time (20‑second interval) and historical visibility across VMware environments, consolidating VM, host, storage, and network analytics into one dashboard to prevent downtime, optimize resource utilization, and ensure peak performance.
· Dennis
Learn to monitor VMware vSphere configurations with a bash script and REST API. Collect VM details like CPU, memory & disk capacity - no extra tools needed
We use Google Analytics cookies to understand how the site is used. Nothing is loaded unless you accept. Privacy policy