New from Opvizor: PostgreSQL, MySQL, MongoDB, SQL Server, Redis
DBFrog sees inside your databases: live, replayable and AI-optimized
Live metrics, AI-driven tuning and security fixes, SQL drilldowns and history replay, all in one easy-to-use panel for PostgreSQL, MySQL, MongoDB, Microsoft SQL Server and Redis. No dashboards to build, no queries to write: add an instance and start fixing.
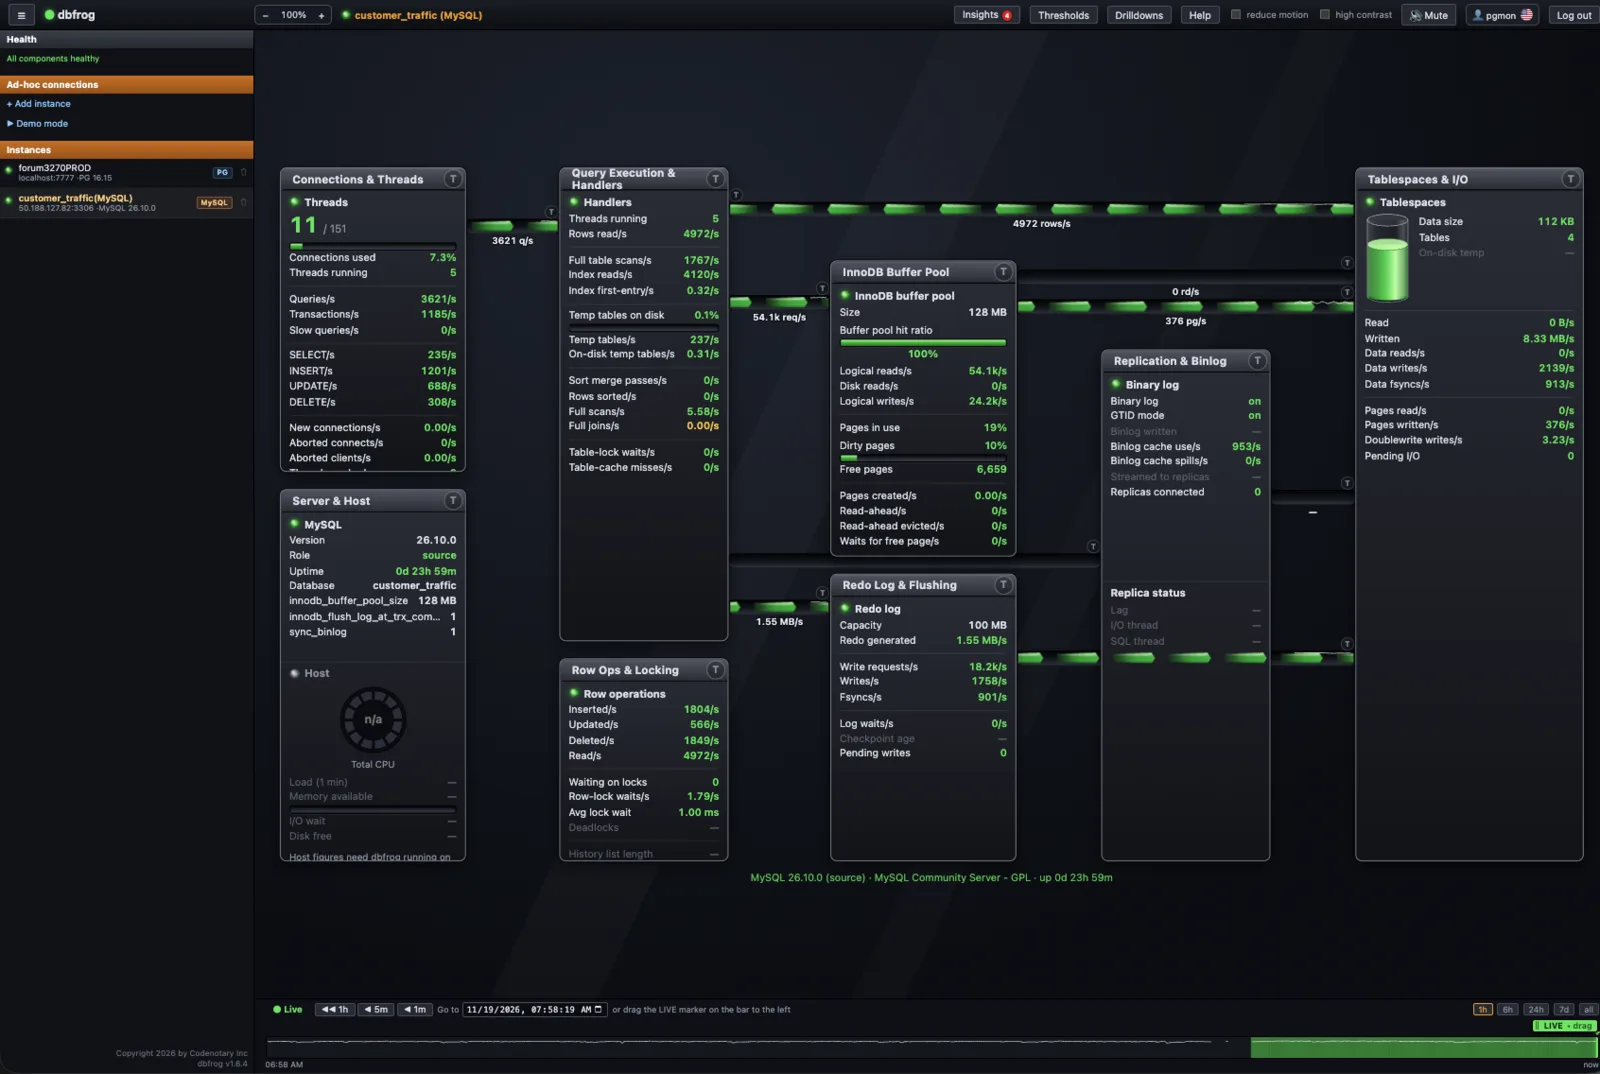
Live MySQL view: every subsystem and the traffic between them, refreshed in real time.
5
Database engines: PostgreSQL, MySQL, MongoDB, Microsoft SQL Server and Redis, cloud or on-premise
AI
AI-driven tuning and security recommendations
Replay
Replayable history, going back as far as you want
$4
Per database instance per month. 17% off with a yearly plan
Spot problems instantly
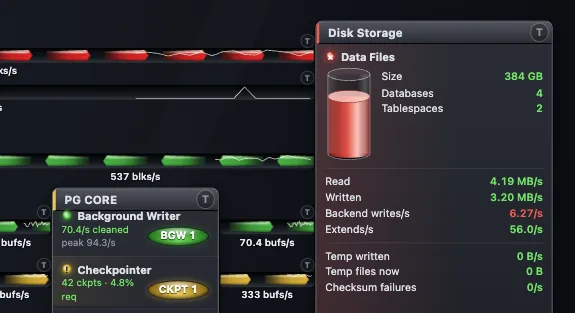
Critical issues turn red. You see them in a second.
No hunting through graphs. When a subsystem is in trouble, its panel, its status light and the data flows feeding it change color, so the problem area stands out across the whole engine.
Click the red panel to drill down, or open Insights for the AI-recommended fix.
- Green: healthy, nothing to do
- Amber: worth a look, like a busy checkpointer
- Red: critical, like backends forced to write to disk themselves
Live view
The whole engine on one screen, not forty graphs
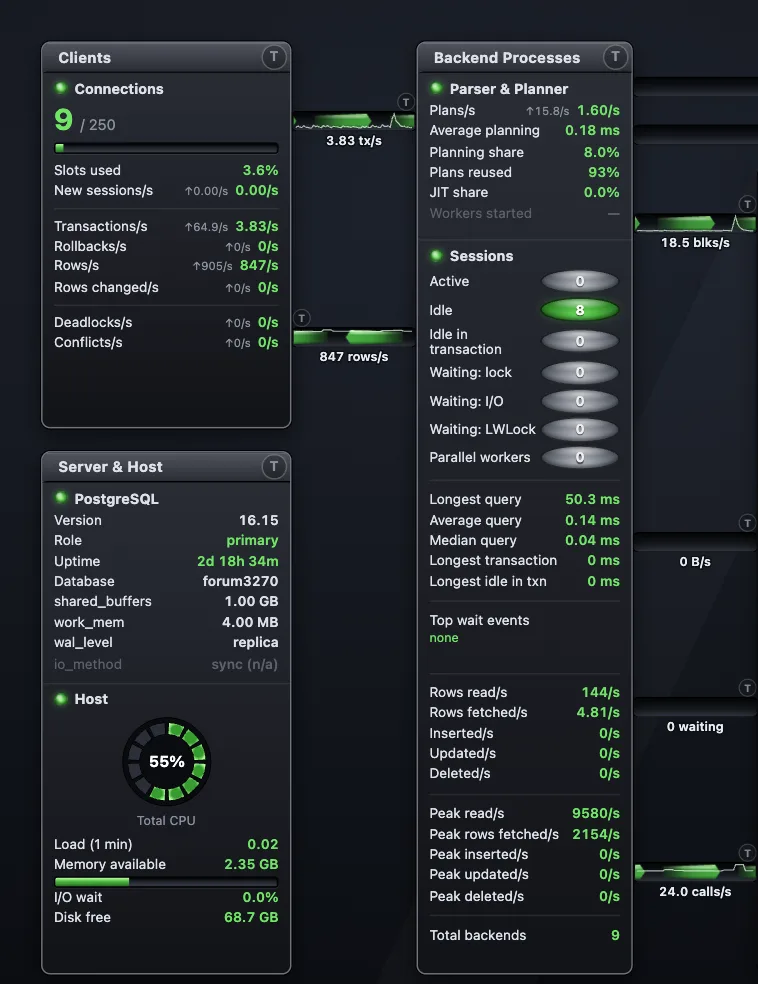
DBFrog draws your database the way it actually works: clients feed backends, backends hit buffers, buffers flush to WAL and disk. Each panel shows the numbers that matter, with green, amber and red so you spot trouble from across the room.
- Connections, sessions and wait states at a glance
- Planner, buffer pool, redo/WAL, replication and I/O panels
- Host CPU, memory, I/O wait and disk alongside the database
- Reduce-motion and high-contrast modes built in
Microsoft SQL Server
Same one-panel view, built for each engine
DBFrog speaks each database’s own language. On SQL Server you get sessions and worker threads, compilations and plan cache, buffer pool and page life expectancy, the transaction log, TempDB, locks and Always On availability groups (on Windows or Linux), all on one screen.
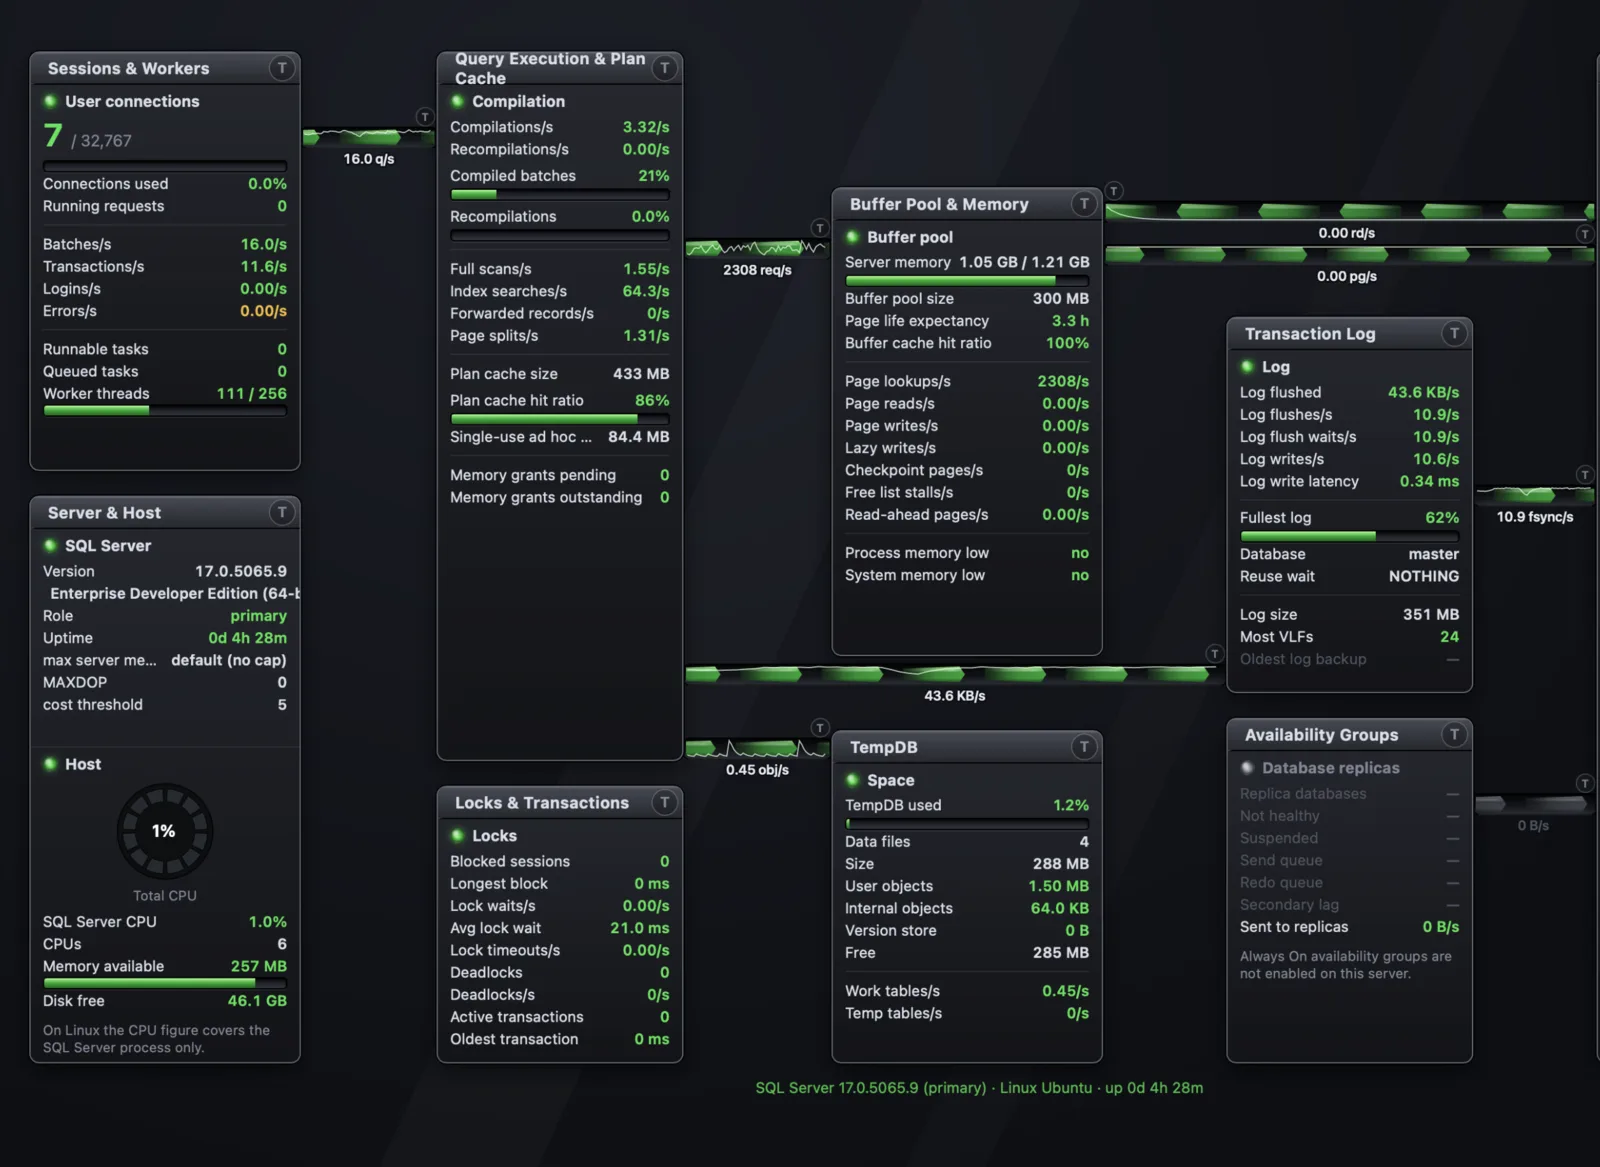
Live SQL Server 2025 view on Linux Ubuntu.
AI-driven insights
Not just “something’s wrong”: what to do about it
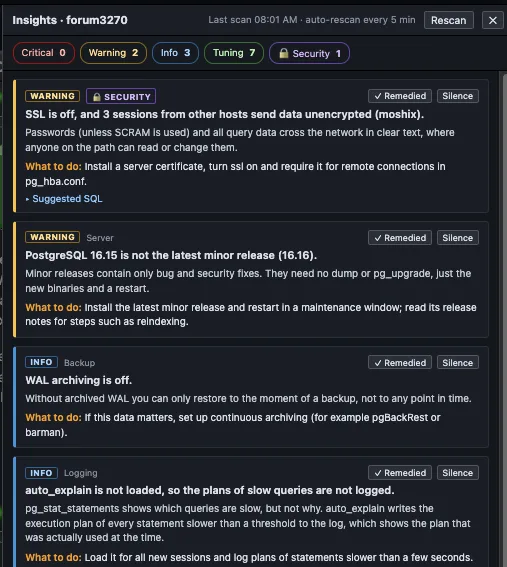
DBFrog scans configuration, versions, security and workload, then explains each finding in plain language. Every insight comes with a concrete next step and, where it helps, the SQL or command to run, for PostgreSQL, MySQL, MongoDB, SQL Server and Redis alike.
Findings are graded Critical, Warning or Info and tagged Tuning or Security. Mark findings remediated or silence them, and DBFrog re-checks automatically every five minutes.
Thresholds & drilldowns
Set your limits. Then dig down to the single statement.
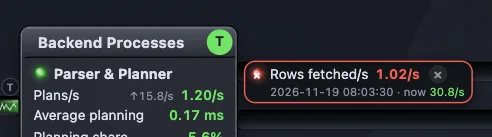
Threshold management
Put a threshold on any metric with the T button on each panel. When it’s crossed, DBFrog flags the value, the moment it happened and where it stands now, so a spike that’s already over still gets noticed.
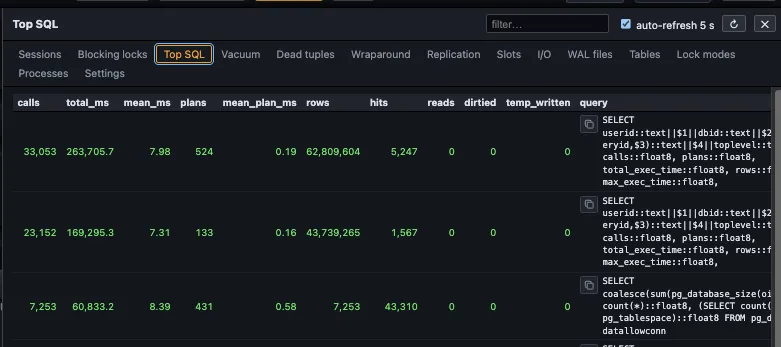
Drilldowns to individual SQL and timing
Open Top SQL to see each statement with its calls, total and mean time, planning time, rows and cache hits. Filter, copy the query, and jump to sessions, blocking locks, vacuum, replication, WAL and more: sessions, blocking locks, Top SQL, vacuum, dead tuples, wraparound, replication, slots, I/O, WAL files, tables and lock modes.
Problem-history replay
Rewind to 3:12 a.m. and watch it happen again
The incident is over by the time you log in? Drag the LIVE marker back, or jump to an exact date and time. Every panel, flow and drilldown replays exactly as it was, so post-mortems start with evidence, not guesses.
- Step back 1 min, 5 min or 1 hour with one click
- Zoom the timeline from 1 hour to 7 days, or all history
- Go to any timestamp and compare it with now
Easy to install
Start optimizing and fixing in 2-3 minutes
No schema changes, no agents to roll out, no dashboards to configure. Point DBFrog at an instance and everything (live view, insights, drilldowns and replay) is there in one panel.
- 1
Install DBFrog
Run it on any Linux host or VM and open it in your browser:
./dbfrog - 2
Add an instance
Click “Add instance”, enter host, port and a monitoring user for PostgreSQL, MySQL, MongoDB, Microsoft SQL Server or Redis. Add as many as you run, and mix engines freely.
- 3
Watch, fix, replay
The live view, insights and history start immediately. Not ready to connect? Try Demo mode first.
Pricing
One price. Every feature. Per instance.
Live view, AI insights, thresholds, drilldowns and history replay are included for every instance (PostgreSQL, MySQL, MongoDB, Microsoft SQL Server or Redis) at the same price.
Monthly
$4per instance per month
- Every feature included
- All five database engines
- No credit card needed to download DBFrog and see it in action
Yearly
Save 17%
$39.84per instance per year ($3.32/month)
- Every feature included
- All five database engines
- 17% off versus monthly billing
Volume discounts for larger fleets: talk to us.
Know what your databases are doing, now and at 3 a.m. last Tuesday
Try DBFrog on your own PostgreSQL, MySQL, MongoDB, Microsoft SQL Server and Redis instances.