


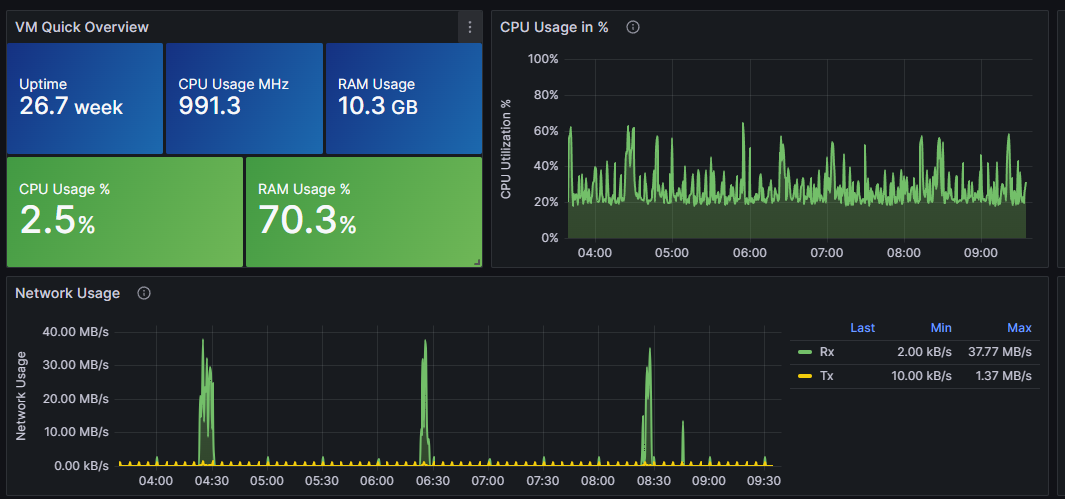
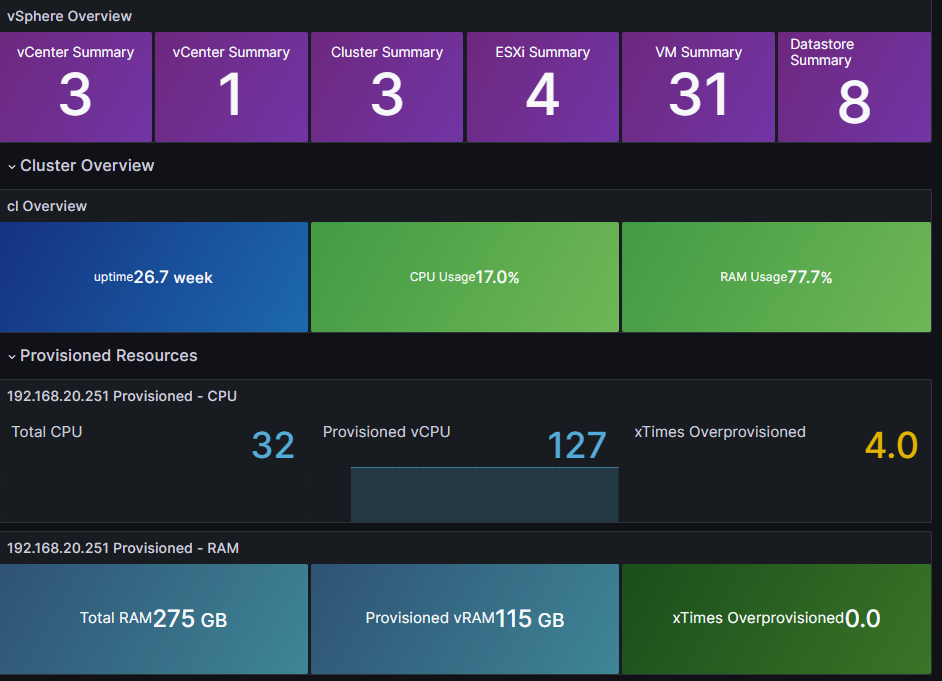
VMware vSphere monitoring integration enables comprehensive insight into your virtualized environment.
- real-time performance metrics to identify and resolve bottlenecks, forecasts future resource needs, and helps optimize resource allocation.
- dealing with CPU, memory, or network issues, this monitoring tool makes troubleshooting a breeze.
- automated alerts, intelligent analytics, and easy-to-read dashboards, vSphere monitoring integration ensures a seamless, efficient, and proactive approach to managing your virtual infrastructure.
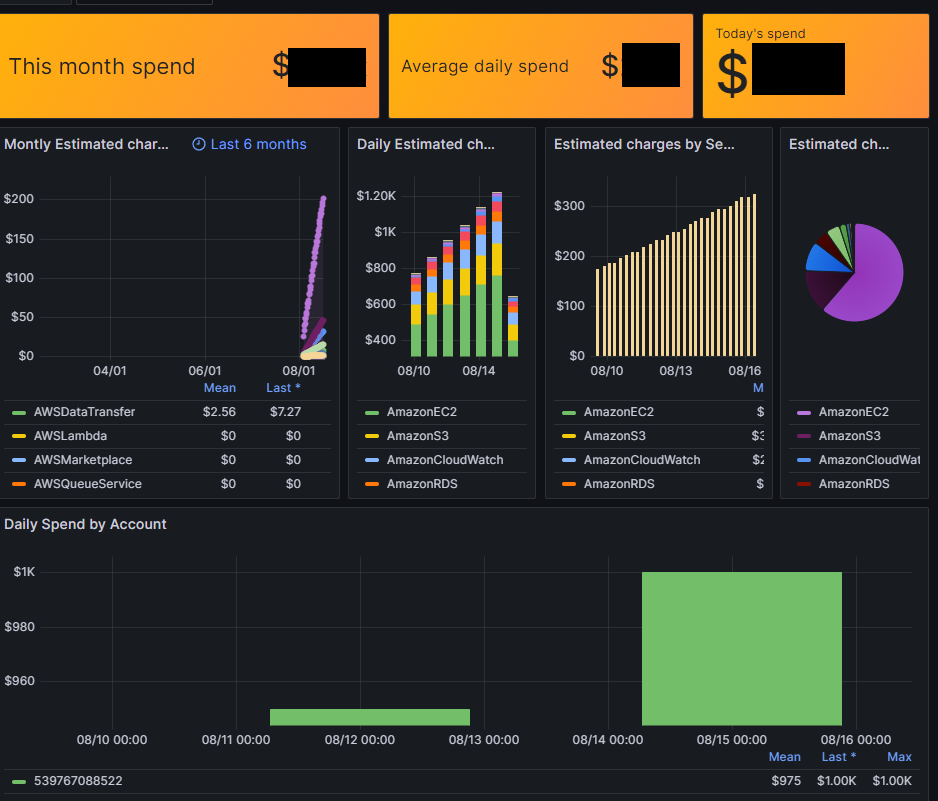
AWS monitoring integration provides a comprehensive view of your cloud resources and services, helping you manage costs, optimize performance, and ensure the health of your cloud environment.
- insights into Billing, you can track your cloud spending and set up budget alerts to proactively manage your costs.
- CloudWatch integration allows you to monitor the performance and health of your AWS resources, set up automated alarms, and gain valuable insights from logs and metrics.
- monitoring for EBS, you can optimize storage performance and capacity, and with S3 monitoring, you can track object storage usage and access patterns.
- EC2 monitoring helps you optimize compute resources and monitor instance health, while Kinesis monitoring provides insights into your streaming data.
- Lambda monitoring helps you track the performance of your serverless applications, and RDS monitoring gives you insights into your database performance and health.
- automated alerts, detailed analytics, and user-friendly dashboards, AWS monitoring integration enables proactive, efficient, and reliable cloud management.
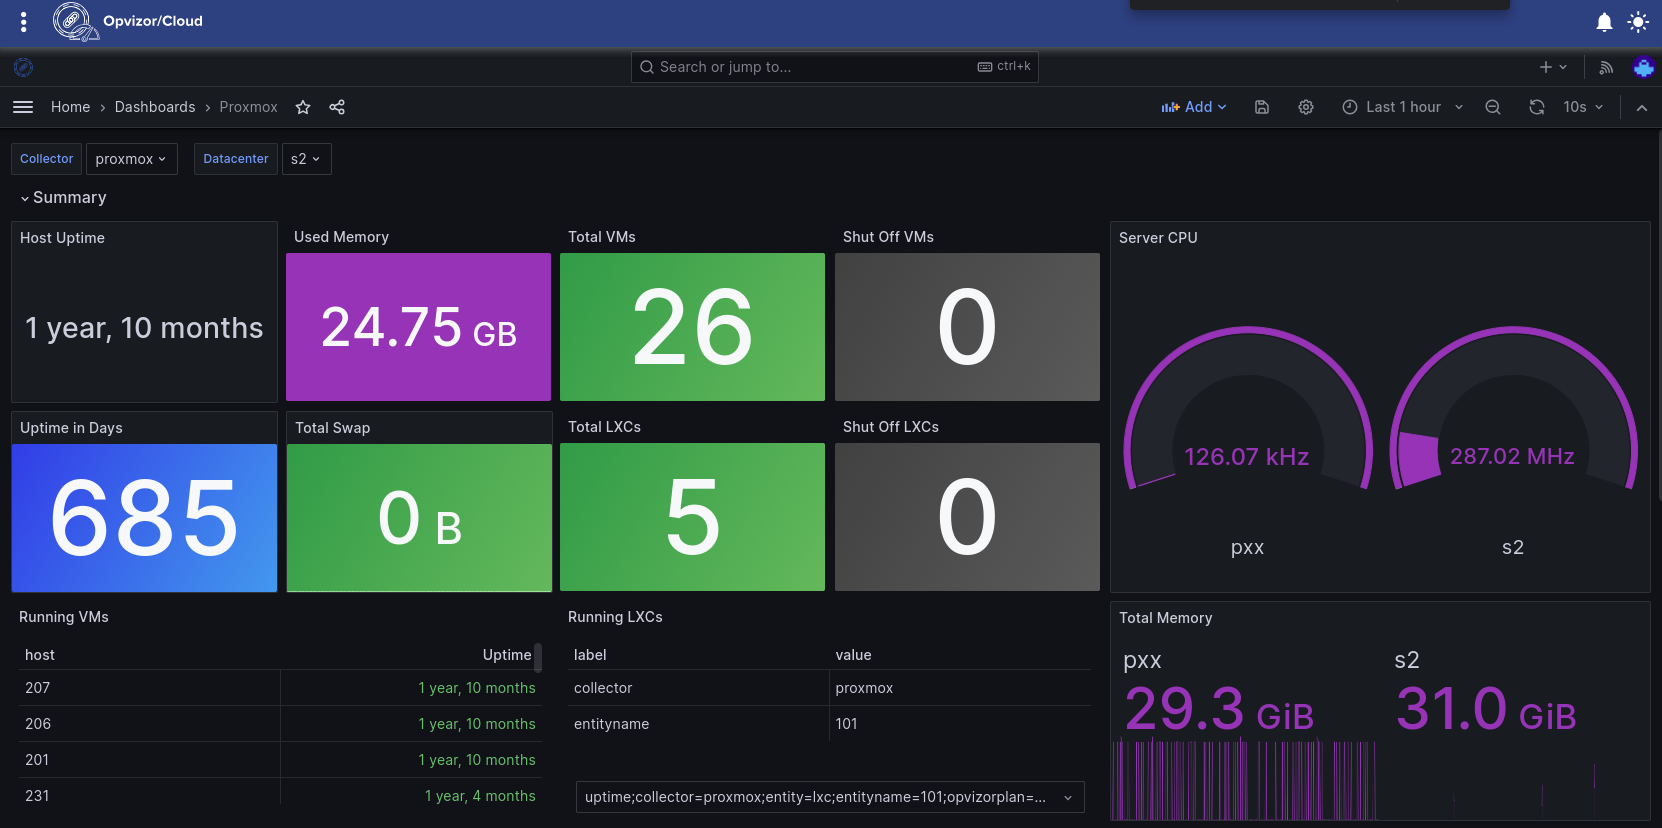
Proxmox VE monitoring integration delivers an all-encompassing perspective of your virtual and containerized landscape. It offers:
- Real-time performance insights for your Proxmox hosts, clusters, virtual machines (VMs), and containers, empowering you to pinpoint and resolve performance constraints, fine-tune resource distribution, and guarantee the stability and accessibility of your virtualized ecosystem.
- Strategic tools for capacity forecasting, resource stewardship, and predictive analysis, enable you to anticipate future demands and adeptly oversee your Proxmox infrastructure.
- Swift diagnosis of virtualization-centric challenges, diminishing downtime, and bolstering the dependability of your virtualized solutions.
- With automated notifications, in-depth analytics, and intuitive dashboards, Proxmox VE monitoring integration facilitates proactive, streamlined, and trustworthy management of your virtualization deployments.
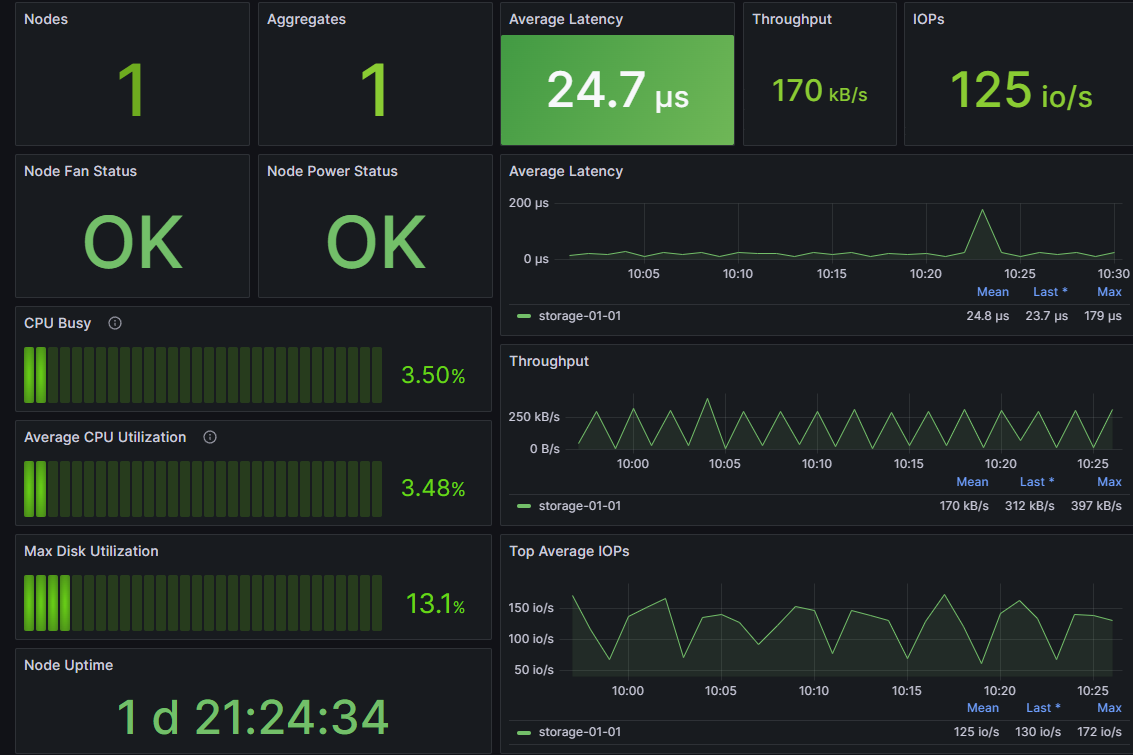
NetApp Filer monitoring integration offers a comprehensive view into the performance and health of your storage systems.
- in-depth visibility into storage resource utilization, helping you optimize capacity, improve performance, and predict future needs.
- real-time metrics to quickly diagnose and troubleshoot storage-related issues, reducing downtime and enhancing overall system reliability.
- automated alerts, detailed analytics, and user-friendly dashboards, NetApp Filer monitoring integration enables proactive management, ensuring your storage infrastructure runs smoothly and efficiently.
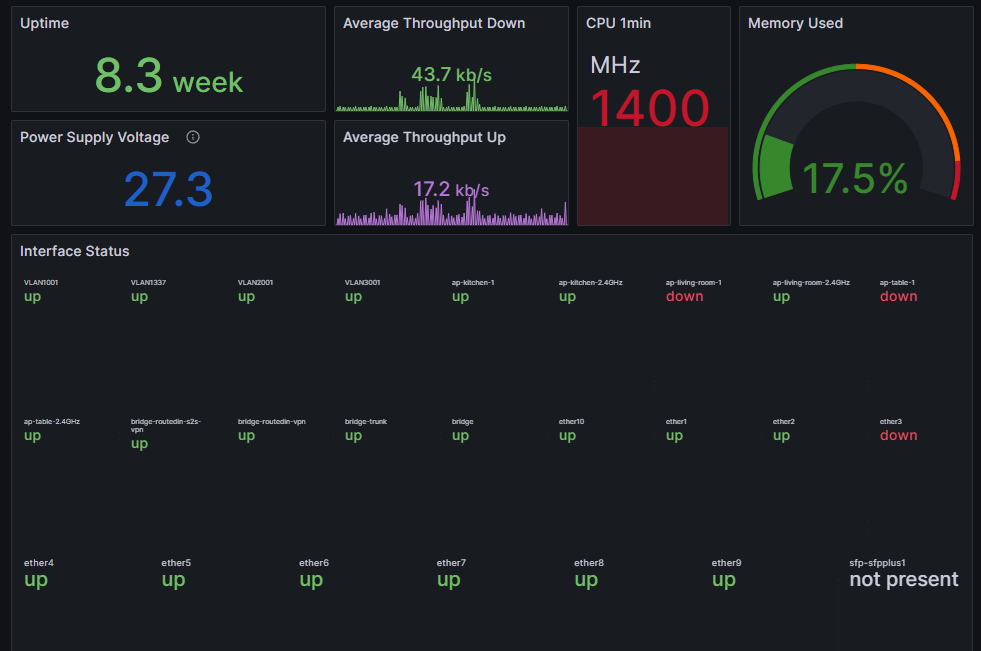
Cisco switch and router monitoring integration provides a holistic view of your network infrastructure.
- real-time metrics on bandwidth usage, network performance, and device health, helping you identify bottlenecks and maintain optimal network performance.
- tools for traffic analysis, forecasting, and resource management, you can proactively plan for future network demands and efficiently allocate resources.
- easy troubleshooting of connectivity issues, reducing downtime and ensuring reliable network services.
- automated alerts, insightful analytics, and intuitive dashboards, Cisco switch and router monitoring integration ensures seamless, efficient, and robust network management.
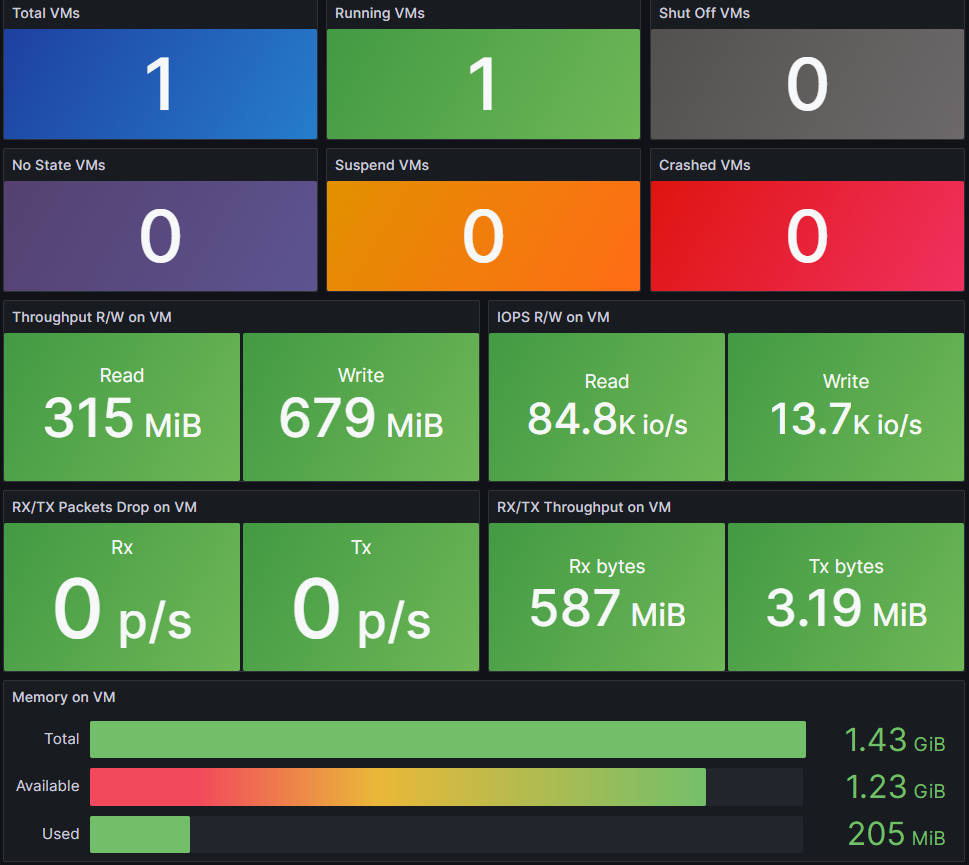
Oracle KVM libvirt monitoring integration provides a comprehensive view of your virtualized infrastructure.
- real-time performance metrics for your KVM hosts and virtual machines (VMs), enabling you to identify and address performance bottlenecks, optimize resource allocation, and ensure the health and availability of your virtualized environment.
- tools for capacity planning, resource management, and forecasting, you can proactively plan for future resource needs and efficiently manage your KVM infrastructure.
- quick troubleshooting of virtualization-related issues, reducing downtime and enhancing the reliability of your virtualized services.
- automated alerts, detailed analytics, and user-friendly dashboards, Oracle KVM libvirt monitoring integration enables proactive, efficient, and reliable virtualization management.
-
24/7 Uptime Monitoring
-
Reduced Operational Overhead
-
Access to Expert Support
-
Scalability and Flexibility
Hosted Infrastructure and Application Monitoring without hazzle
Our hosted solution provides around-the-clock monitoring of your infrastructure and your applications.
This means that any issues that arise can be quickly detected, sometimes even before they impact the end user.
This 24/7 monitoring can provide peace of mind for system administrators, who won't need to constantly check on the system themselves.
Moreover, our robust functionality for detecting potential bottlenecks and forecasting future issues empowers you to circumvent problems long before they manifest.

Streamlining System Management: Lowering Costs and Elevating Efficiency
Using our hosted solution, system administrators can offload some of the burdens of managing the infrastructure and application monitoring.
This frees up valuable time for the team to focus on other important tasks, improving efficiency and productivity.
Additionally, it also reduces the need for investment in physical hardware and the associated maintenance costs.

Guidance at Your Fingertips: Leveraging Professional Expertise for Seamless Operations
Our hosted solutions come with expert support from the provider.
This means that system administrators can have direct access to a team of experts who can provide assistance in case of any issues or questions.
This can be particularly beneficial for dealing with complex or difficult problems.

Adapting to Your Needs: Harnessing the Power of Scalable and Flexible Solutions
As businesses grow, their IT needs can change. Opvizor Cloud scales more easily to meet these changing needs.
Whether your company needs to handle more data, add more users, or incorporate new applications, our hosted monitoring solution can adapt more easily than any in-house system.
