VMware, AWS and Azure: Troubleshooting and remediation for multi-cloud.
No ticket overload, faster resolution, smoother operation excellency with our AI powered expert.
Examples of our customers' success with Opvizor
Recovery of over 1.2 TB of storage space within a few weeks.
By recognizing unused VMDKs, leftover VMs in the data store and old snapshots, it is not uncommon to save hundreds of GB. Some customers have recovered over a TB within a month.
Detection of a missing redundancy that caused a massive network packet failure.
Using the performance monitoring and the built-in alerts to detect network package anomalies, the root cause was identified in hours.
Saving an investment of 2 million dollars by optimizing the NUMA configuration.
With an overview of NUMA usage and displacement over several months, the customer was able to avoid excessive hardware expenditure. The environment already consisted of 380 ESXi hosts.
Detection of ransomware based on an unusual hard disk usage pattern.
Suddenly, one system experienced huge spikes in read and write access to the hard disk, triggering Opvizor warnings. As Microsoft Windows was also being monitored, the customer was able to quickly identify and stop the process before it could cause any major damage.
Opvizor's AI Companion
Your Ultimate Cloud Operations Ally
Unlock unprecedented efficiency and accuracy in your cloud operations with Opvizor's AI Companion. Seamlessly integrating with your daily tasks, our AI harnesses the power of real-time insights, extensive knowledge bases, and script automation, ensuring you're always a step ahead in the digital realm.
Remediate issues faster and more effective
- Troubleshooting for configuration, metrics, and logs
- Smart Knowledge Base Search
- Intelligent VMware Manual Search
- Automated PowerShell Scripts
- Linux command line and scripting assistance
- Kubernetes Configurations Mastered
- support for many scripting and spoken languages

Virtual Infrastructure Health
- Always stay on top of your virtual infrastructure and feel the pulse of your environment
- Monitor vital metrics of your most important virtual machines, check the network utilization of your ESXi host and much more from a single pane of glass.

Everything you need to run a fast and reliable Cloud environment
Never miss a beat
Connect the dots and find bottlenecks across your virtual and cloud infrastructure. VMware ESXi, Virtual Machines, vCSA, Storage, Network, Applications. Performance and Log data close to realtime.
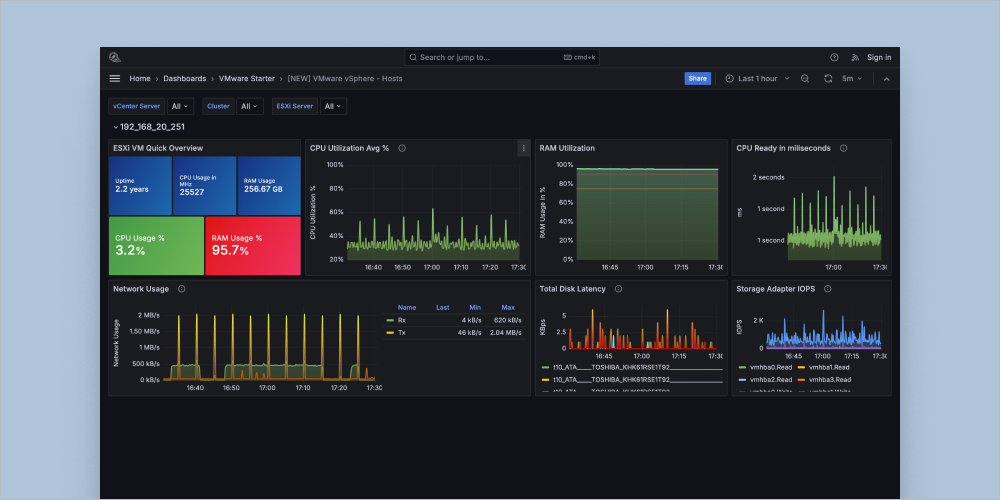
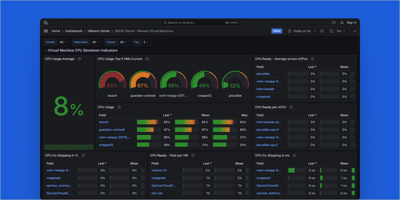
30+ integrations
VMware vSphere, VMware Horizon, NetApp, Cisco, Brocade, Linux, Windows, MS SQL, Oracle, PostgreSQL, Dell PowerMax, Docker, Kubernetes, Tanzu and more
Data correlation
Use performance data, configuration data, log feeds and events correlated in one dashboard view. Get alerted based on unwanted configurations, performance deterioration, or outages.
Fully customizable
Create new dashboards or customize existing dashboards to meet your needs. Choose from more than 50 built-in dashboards that meet specific needs.
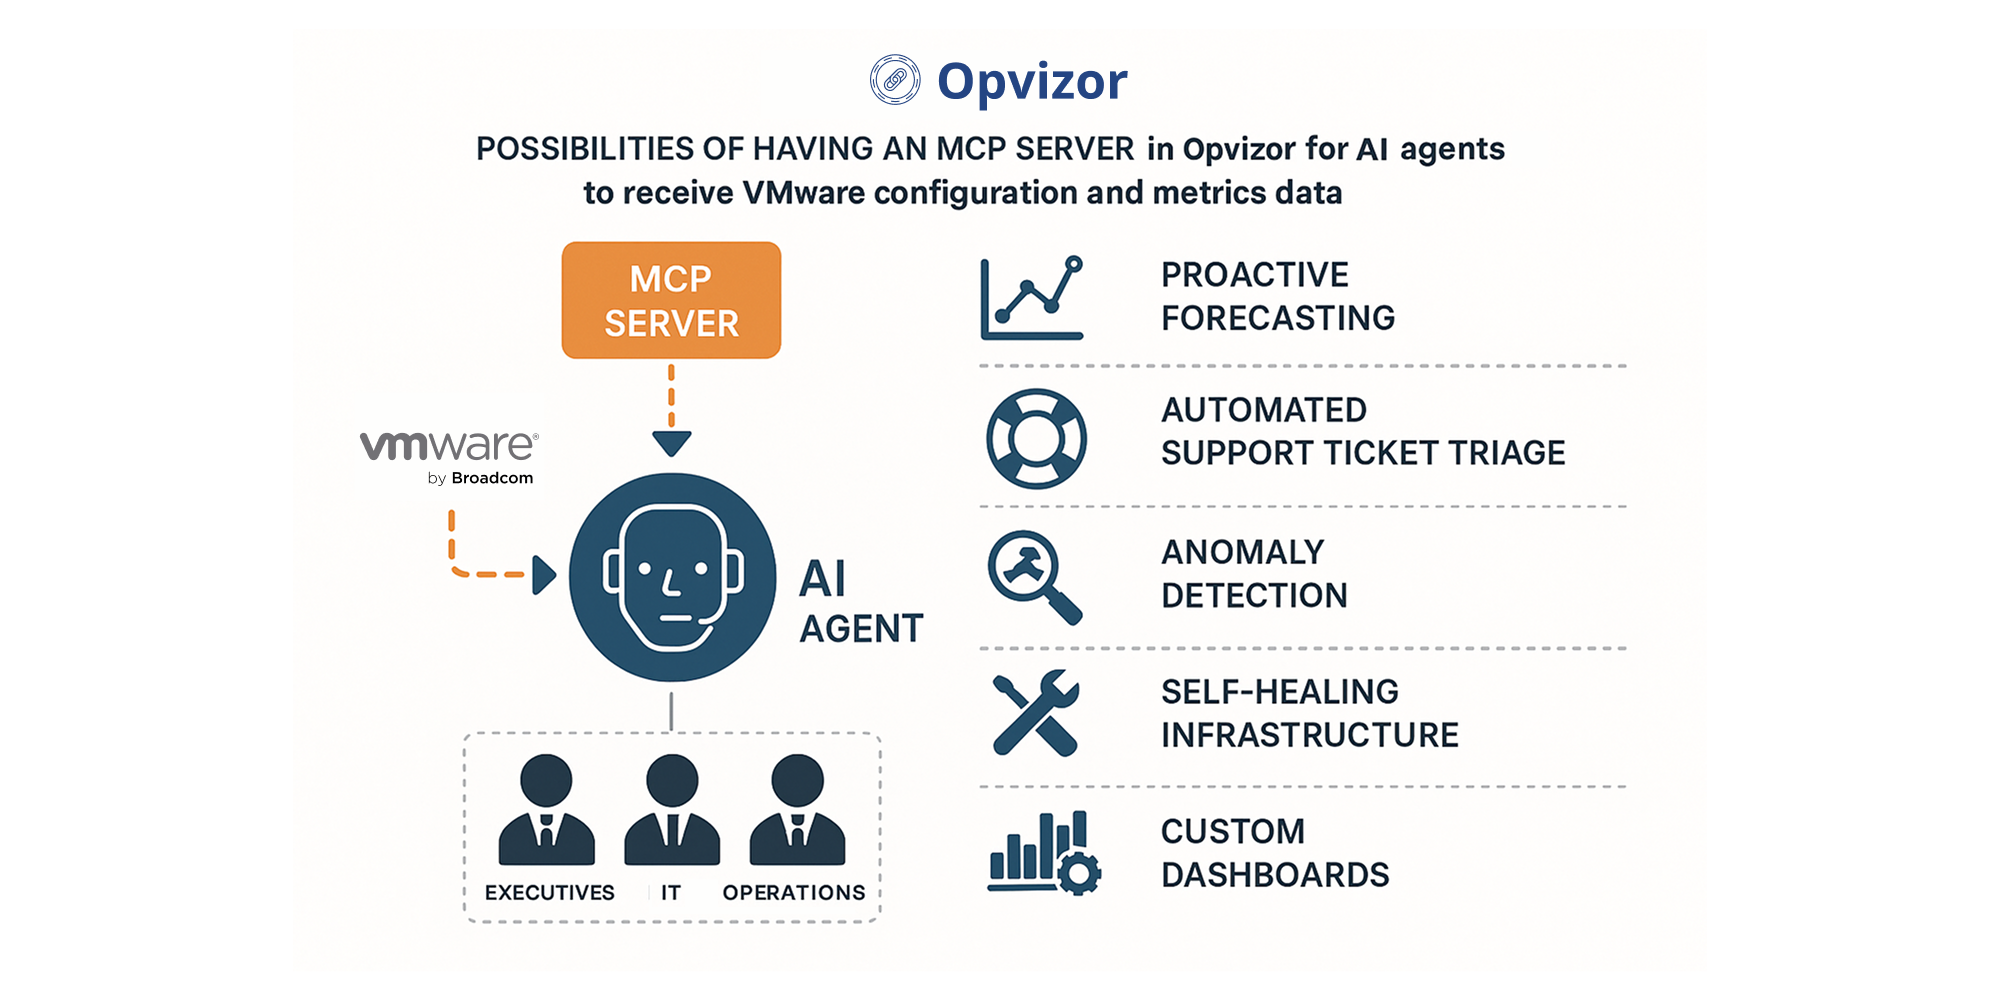
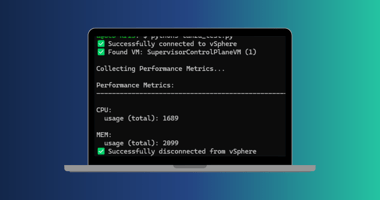
What our customers say
“It makes for a great one-stop shop for monitoring key VMware metrics! It comes pre-packaged with ready-to-use dashboards that are color coded with thresholds providing immediate feedback on performance, KPIs, health, and areas of concern. I’m very pleased with the application and the support team behind it. Highly recommended!”
“The tremendous flexibility and the possibility to create your own dashboards with metrics and logs you want to keep one eye on it all the time across different infrastructure products from different vendors. I also like the amazing support from the Opvizor team!”
“With Opvizor we have a one-stop visualization to monitor our resources across our VMware infrastructure and Microsoft Azure cloud deployments. This makes it easy for us to pinpoint performance issues and their root causes independently of the platform. This is something difficult to achieve with the monitoring tools provided by either VMware or Azure.”
Find bottlenecks and optimize your VMware Virtual Machines
Check VM CPU, Memory, Network and Disk performance
Monitor and optimize your VMware ESXi hosts
Check CPU, Memory, Network, Disk and VMkernel performance
Subscription plans for every infrastructure size
Starter
starts at $550/year
Up to 10 ESXi hosts
Includes performance monitoring and log analysis + 3 more extensions.
-
Online support
-
VMware vSphere Performance Data
-
VMware vSphere Log analysis
-
3 more extensions (Linux, Windows, DB)
-
on-premises installation
Enterprise
starts at $4800/year
No Hosts limitation / licensed per host
Deploy one or many Opvizor instances to maintain the best application performance.
-
all Starter features
-
no extension limit
-
Cloud or on-premises
-
high-availability
-
24/7 online support
Extensions
Custom
Get in touch for a custom quote
Add infrastructure, resource planning or application monitoring to Opvizor.
-
Operating Systems
-
Databases
-
Storage Systems
-
Network Components
-
Compliance Modules
Need clarification?
Can I run Opvizor on-premises?
Yes, Opvizor runs without any internet connectivity.
Opvizor is available as a virtual appliance that you can import into your VMware vSphere environment. Patches can be downloaded from our customer portal and installed without any internet access.
Do I need to install any agents to collect VMware vSphere data?
Many integrations work without installing an agent:
- VMware vSphere
- NetApp
- Microsoft SQL
- Oracle
- PostgreSQL
- Dell PowerMax
- Cisco UCS
- Cisco Switches
- Brocade Switches
Agents are required for Operating System data and some applications.
How to analyze log data?
Opvizor supports the Syslog protocol and you can simply configure the ESXi hosts, the vCSA appliance and many other systems to send data to the virtual appliance.
How well does it scale?
Opvizor has been developed with scalability and efficiency in mind. Most deployments consist of a single virtual appliance that can consume all metrics, logs and configuration data. When exceeding 100 ESXi hosts and 1500 VMs, we recommend a split into 2 virtual appliances. In any case, you see all data within the dashboards.