Do you want to monitor and optimize Kubernetes performance? Are you looking for tools to help you with this? If so, then you have come to the right place! In this blog, we will discuss how you can use Opvizor for monitoring Kubernetes, Tanzu, and Openshift, and use it to optimize your Kubernetes performance.
Introduction to Kubernetes Monitoring
Kubernetes is an open-source container orchestration system used to manage containerized applications. It is used to automate the deployment, scaling, and management of applications in a distributed environment. Kubernetes also provides the ability to monitor and measure the performance of applications running on it. Monitoring Kubernetes is essential to ensure that applications are running as expected and making the most of the resources available.
Monitoring Kubernetes involves collecting and analyzing performance data, such as CPU and memory utilization, networking, and storage. These performance metrics help in understanding the resource consumption of applications and optimizing their performance. Kubernetes monitoring can also help in identifying potential issues before they become a problem.
What is Opvizor for Monitoring Kubernetes, Tanzu, and Openshift?
Opvizor is a cloud-native monitoring and analytics solution for Kubernetes, Tanzu, and Openshift. It provides real-time visibility into the performance of applications running on Kubernetes clusters. Opvizor can monitor and analyze resource utilization, network performance, and application health.
Opvizor provides a comprehensive set of features to help you understand and optimize Kubernetes performance. It uses Prometheus and Grafana to collect and visualize performance data. It also provides advanced analytics to identify potential issues and suggest optimization strategies.
What about managed Kubernetes services like EKS, AKS or GKE?
With managed Kubernetes services like EKS, AKS, and GKE, Opvizor offers a cloud-native monitoring and analytics solution to optimize the performance of applications running on Kubernetes clusters. It provides real-time visibility into resource utilization as well as network performance and application health.
This is beneficial for organizations looking to get the most out of their Kubernetes deployments. With Opvizor's performance monitoring capabilities, they can proactively identify and resolve issues before they can affect their applications’ uptime and stability.
Benefits of Using Opvizor for Monitoring Kubernetes
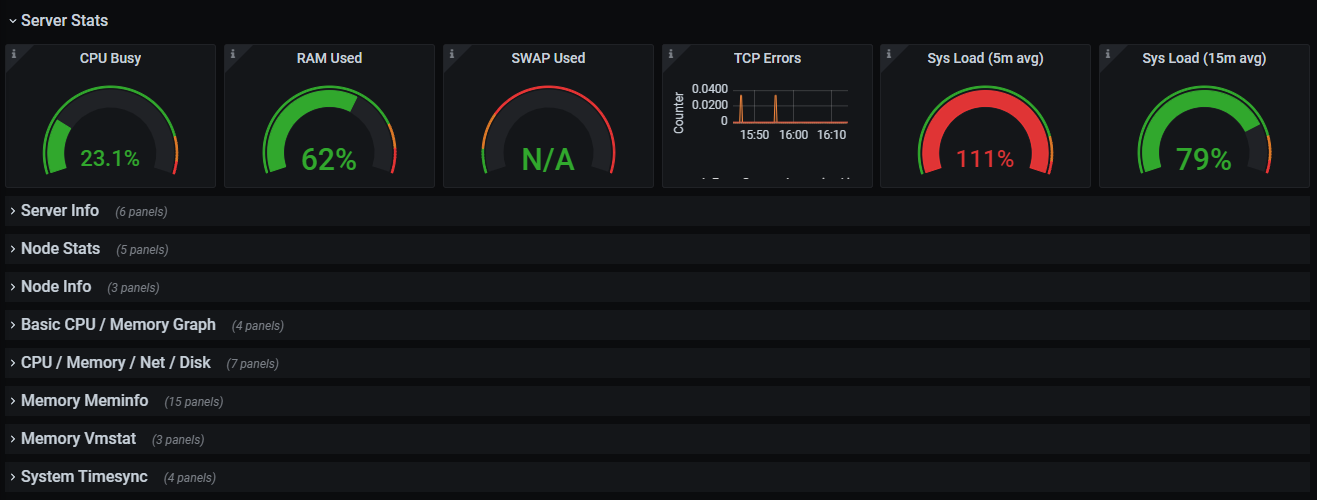
Using Opvizor for monitoring Kubernetes has several benefits. It provides real-time visibility into the performance of applications running on Kubernetes. This helps in identifying potential performance issues before they become a problem. As the gathered performance and infrastructure data can be combined with the underlying physical and virtual environment, a full-stack view is available.
Opvizor also provides advanced analytics to identify and address performance bottlenecks. It can detect inefficiencies in resource utilization and suggest optimization strategies. This helps in optimizing the performance of applications running on Kubernetes.
Opvizor also provides an intuitive user interface that makes it easy to monitor and analyze Kubernetes performance. It provides detailed insights into resource utilization, network performance, and application health. This helps in understanding the performance of applications and taking the necessary steps to optimize them.
How to Monitor Kubernetes with Opvizor
Monitoring Kubernetes with Opvizor is easy and straightforward. All you need to do is set up the Opvizor agent on your Kubernetes cluster and configure it to collect the performance data you need.
Once the agent is set up, it will start collecting and analyzing performance data from your Kubernetes cluster. This data is then sent to the Opvizor dashboard for visualization. The dashboard provides detailed insights into the performance of applications running on your Kubernetes cluster.
Namespace utilization
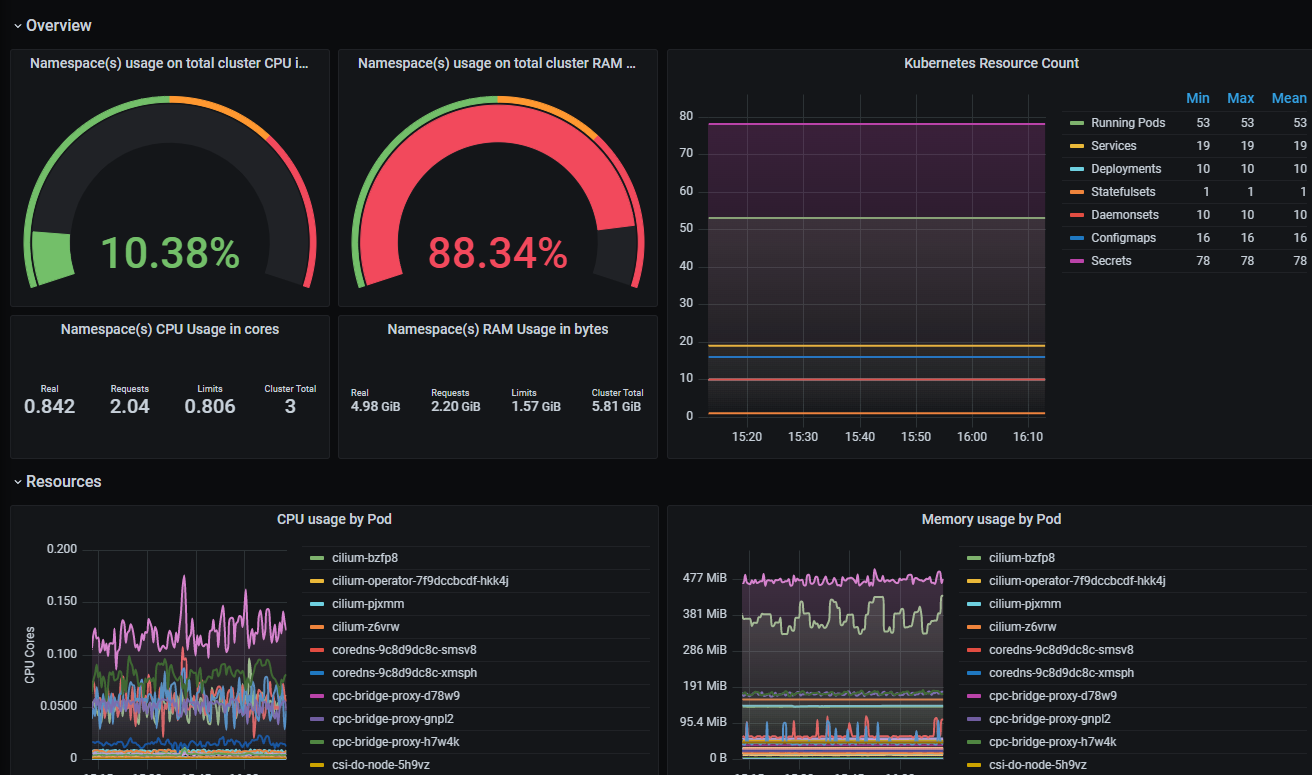
Pods resource usage
Analyzing Kubernetes Performance with Opvizor
Once you have set up the Opvizor agent, you can start analyzing the performance of applications running on your Kubernetes cluster.
Opvizor provides a comprehensive set of features to help you analyze Kubernetes performance. It provides detailed insights into resource utilization, network performance, and application health. This helps in understanding how applications are consuming resources and how to optimize them.
It also provides advanced analytics to identify potential issues and suggest optimization strategies. This helps in ensuring that applications are performing optimally and making the most of the resources available.
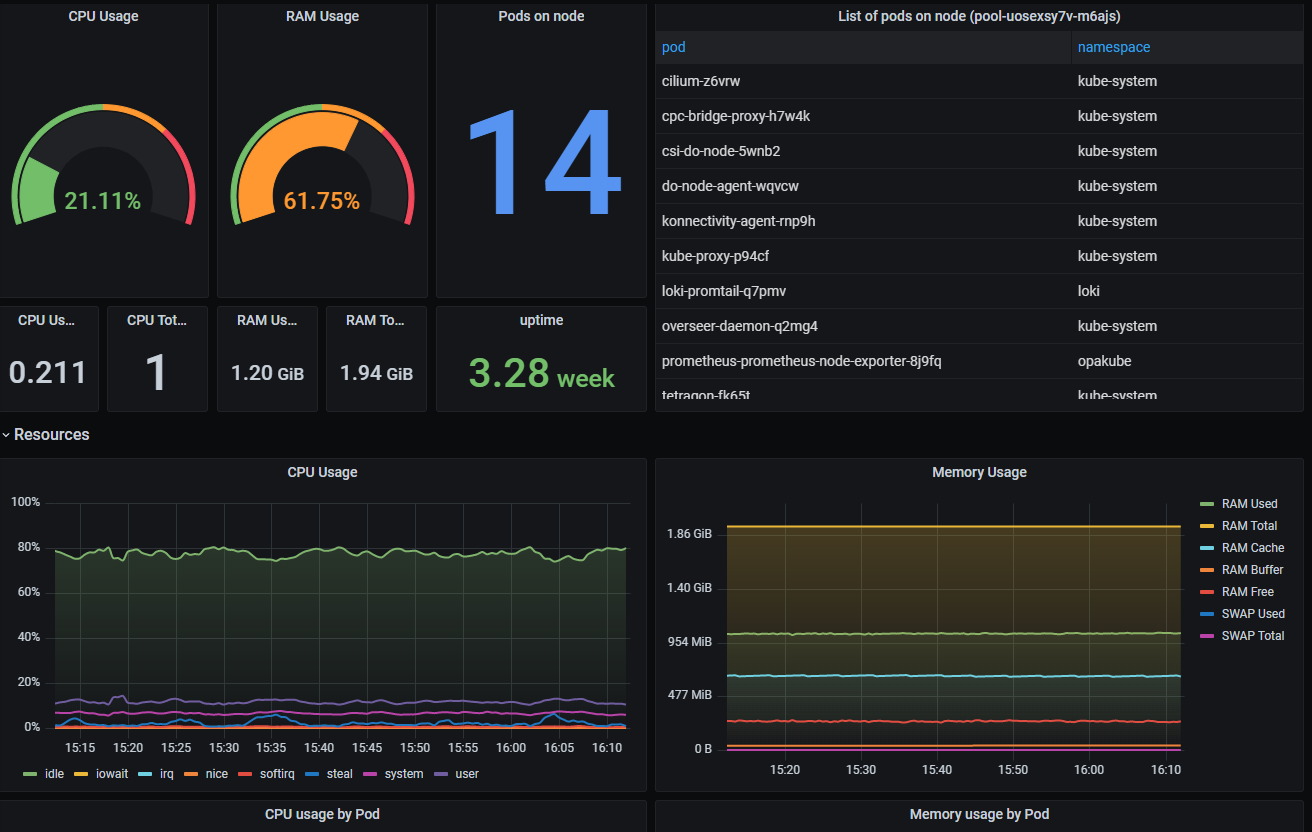
The monitoring is done full stack, Host, VM, Node, Pod, and Container!
Optimizing Kubernetes Performance with Opvizor
Once you have identified potential performance issues, you can use Opvizor to optimize your Kubernetes as well as VMware vSphere performance. Opvizor provides a comprehensive set of features to help you optimize Kubernetes performance.
It provides detailed insights into resource utilization and network performance. This helps in understanding how applications are consuming resources and how to optimize them. It also provides advanced analytics to identify potential issues and suggest optimization strategies. This helps in ensuring that applications are performing optimally and making the most of the resources available.
How to Monitor Kubernetes Resources with Opvizor
Monitoring Kubernetes resources with Opvizor is easy and straightforward. All you need to do is set up the Opvizor agent on your Kubernetes cluster and configure it to collect the performance data you need.
Once the collector is set up, it will start collecting and analyzing performance data from your Kubernetes cluster. This data is then sent to the Opvizor dashboard for visualization. The dashboard provides detailed insights into the resource utilization of applications running on your Kubernetes cluster.
Troubleshooting Kubernetes Performance with Opvizor
Gathering all important metrics in one place allows for efficient troubleshooting through the complete stack. All you need to do is set up the Opvizor collector in your Kubernetes cluster and configure it to collect the performance data you need.
Once the collector is set up, it will start collecting and analyzing performance data from your Kubernetes cluster. This data is then sent to the Opvizor dashboard for visualization. The dashboard provides detailed insights into the performance of applications running on your Kubernetes cluster.
Opvizor also provides advanced analytics to identify potential issues and suggest optimization strategies. This helps in troubleshooting Kubernetes performance and identifying potential issues before they become a problem.
Tips for Achieving Optimal Kubernetes Performance
Achieving optimal Kubernetes performance requires diligent monitoring and optimization. Here are some tips to help you achieve optimal Kubernetes performance:
- Monitor resource utilization: Monitor the resource utilization of applications running on Kubernetes and identify potential issues.
- Optimize resource utilization: Optimize the resource utilization of applications running on Kubernetes to ensure optimal performance.
- Monitor network performance: Monitor the network performance of applications running on Kubernetes and identify potential issues.
- Monitor application health: Monitor the health of applications running on Kubernetes and identify potential issues.
- Collect and visualize performance and usage data using our dashboards.
- Use Opvizor: Use Opvizor to monitor and analyze Kubernetes performance and identify potential issues.
Conclusion
Monitoring and optimizing Kubernetes performance is essential to ensure that applications are running as expected and making the most of the resources available. Opvizor is a cloud-native monitoring and analytics solution for Kubernetes, Tanzu, and Openshift. It provides real-time visibility into the performance of applications running on Kubernetes and advanced analytics to identify potential issues and suggest optimization strategies.
Using Opvizor for monitoring and optimizing Kubernetes performance is easy and straightforward. All you need to do is set up the Opvizor agent on your Kubernetes cluster and configure it to collect the performance data you need.
So, if you want to monitor and optimize Kubernetes performance, then use Opvizor and give it a free spin starting the trial.