Automating and Monitoring long-term Disk Performance Tests with Diskspd and Opvizor

Photo by MiLo-Casellas on Pixabay
Disk performance tests are a crucial part of any IT infrastructure planning and optimization strategy. Automating and monitoring long-term disk performance tests can be a tricky endeavor, but with the help of Diskspd and Opvizor, it doesn't have to be.
Diskspd provides a powerful, flexible, and easy-to-use testing tool, while Opvizor offers comprehensive monitoring and analytics capabilities and can consume the test data to visualize them.

Together, they make it easier than ever to automate and monitor long-term disk performance tests and ensure that your IT infrastructure is running as efficiently as possible.
Never guess what disk controller is performing better for certain workloads and justify your configuration or purchase decisions. While this automation came to live to follow up on the blog post about VMware vSphere disk controller, it can be used for most system setups.
Hint: It can also be a good test when doing proof of concepts for storage (SAN, NAS, Flash) systems.
With Diskspd and Opvizor, you can quickly identify issues, take corrective action, and keep your disk performance tests running smoothly.
Benefits of automating and monitoring long-term disk performance tests
A long-term disk performance test can help you ensure the continued load and performance capabilities of your storage platform and detect signs of potential problems or misconfigurations.
Automating and monitoring disk performance over time can also help you identify new configuration or overload issues identify issues and take corrective action before any major problems occur.
Of course, if you plan for future storage needs by tracking trends over time and making predictions about future disk performance all long-term measurement data can be pure gold.
Running disk performance tests automated and continuously, helps to keep you alerted to any anomalies and helps to ensure that your IT infrastructure is running at peak efficiency.
Automating disk performance tests with Diskspd
Diskspd allows you to run a variety of tests against disks and volumes, including sequential read, random read, and write tests as well as verification tests to determine the health of your disks. Diskspd can also generate synthetic workloads on a specified disk.
If you choose to use Diskspd with PowerShell, you can easily create a disk performance schedule using the telegraf capability in combination with Opvizor.
You can simply run a telegraf job that is performed every hour and sends data via the Influx output to Opvizor. The following config file should be placed in the telegraf.d folder to have a proper separation. You might need to play with the interval and the timeout.
telegraf.d\diskspd.conf
[[inputs.exec]] commands = [ 'powershell -File C:/DiskSpd/amd64/disksped-win-telegraf.ps1' ] interval = "60m" data_format = "influx" timeout = "20m"
The following script assumes that diskspd is copied to c:\diskspd\amd64 and the Powershell script is also placed there with the name diskspd-win-telegraf.ps1.
You can adjust the script to use different workloads and different drive letters and names for the disks you want to perform the tests.
disksped-win-telegraf.ps1
$cmd="C:\DiskSpd\amd64\diskspd.exe"$data = @()$disks = @( [pscustomobject]@{letter='e'; name='LSI'} [pscustomobject]@{letter='f'; name='Paravirtual'} [pscustomobject]@{letter='g'; name='NVMe'})foreach ($disk in $disks){ $workloads = @( [pscustomobject]@{name='Database'; cmd='-b8k -w30 -t8 -d30 -o16 -h -r -c4G -L '} [pscustomobject]@{name='Email'; cmd='-b4k -w40 -t8 -d30 -o16 -h -r -c4G -L '} [pscustomobject]@{name='File'; cmd='-b64k -w10 -t8 -d30 -o16 -h -r -c4G -L '} [pscustomobject]@{name='Streaming'; cmd='-b5120k -w20 -t8 -d30 -o16 -h -r -c4G -L '} [pscustomobject]@{name='VDI'; cmd='-b4k -w80 -t8 -d30 -o8 -h -r -c4G -L '} [pscustomobject]@{name='OLTP'; cmd='-b8k -w75 -t3 -d30 -o32 -h -r -c4G -L '} ) foreach ($workload in $workloads) { $content = cmd /c $($cmd+" " +$workload.cmd + $disk.letter+ ":\test.dat") $results = ([string]($content | select-string total: | select -first 1)).replace('|',',').replace('total:','') # $maxlatency = ($content)|grep 99th|sed 's/|/,/g' $maxlatency = ([string]($content|select-string 99th)).replace('|',',') # $avgcpu = ($content)|grep avg.|sed 's/|/,/g'|sed 's/avg.,//g' $avgcpu = ([string]($content | select-string avg.)).replace('|',',').replace('avg:','') $results= $results.split(",") $maxlatency = $maxlatency.split(",") $avgcpu = $avgcpu.split(",").replace('%','') $TotalBytes = $Results[0].Trim() $TotalIOPs = $results[1].Trim() $MiBperSec = $results[2].Trim() $IOPs = $results[3].Trim() $AvgLatency = $results[4].Trim() $AvgCPU = $avgcpu[1].Trim() $LatStdDev = $results[5].Trim() $ReadMS = $maxlatency[1].Trim() $WriteMS = $maxlatency[2].Trim() $TotalMS = $maxlatency[3].Trim() $data+= Write-Output "diskspd,workload=$($workload.name),disk=$($disk.name) TotalBytes=$($TotalBytes)" $data+= Write-Output "diskspd,workload=$($workload.name),disk=$($disk.name) TotalIOPs=$($TotalIOPs)" $data+= Write-Output "diskspd,workload=$($workload.name),disk=$($disk.name) MiBperSec=$($MiBperSec)" $data+= Write-Output "diskspd,workload=$($workload.name),disk=$($disk.name) IOPs=$($IOPs)" $data+= Write-Output "diskspd,workload=$($workload.name),disk=$($disk.name) AvgLatency=$($AvgLatency)" $data+= Write-Output "diskspd,workload=$($workload.name),disk=$($disk.name) AvgCPU=$($AvgCPU)" $data+= Write-Output "diskspd,workload=$($workload.name),disk=$($disk.name) LatStdDev=$($LatStdDev)" $data+= Write-Output "diskspd,workload=$($workload.name),disk=$($disk.name) ReadMS99=$($ReadMS)" $data+= Write-Output "diskspd,workload=$($workload.name),disk=$($disk.name) WriteMS99=$($WriteMS)" $data+= Write-Output "diskspd,workload=$($workload.name),disk=$($disk.name) TotalMS99=$($TotalMS)" $data+= Write-Output "diskspd,workload=$($workload.name),disk=$($disk.name) AvgLatency=$($AvgLatency)" }}$data
Monitoring disk performance tests with Opvizor
You can use Opvizor to monitor numerous aspects of your disk performance tests, including the following:
- Test start and end times
- Test duration
- Test configuration
- Test workload type
- Test results
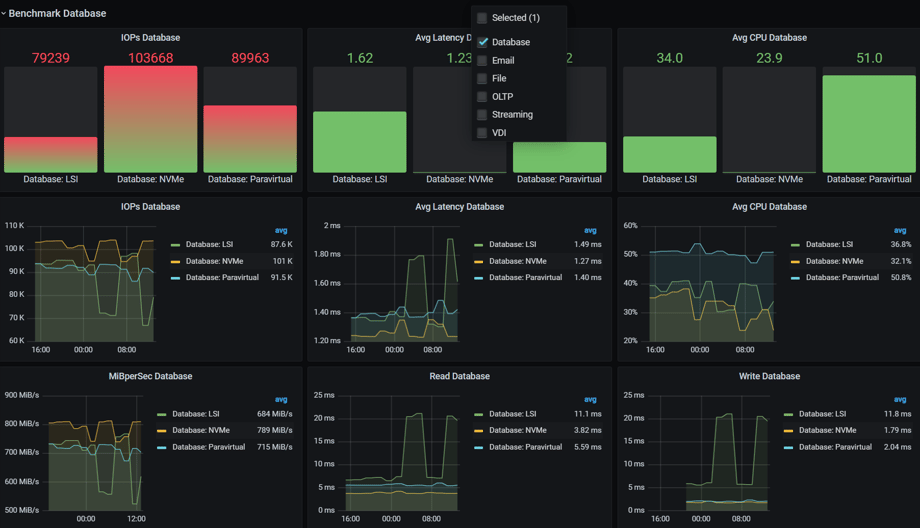
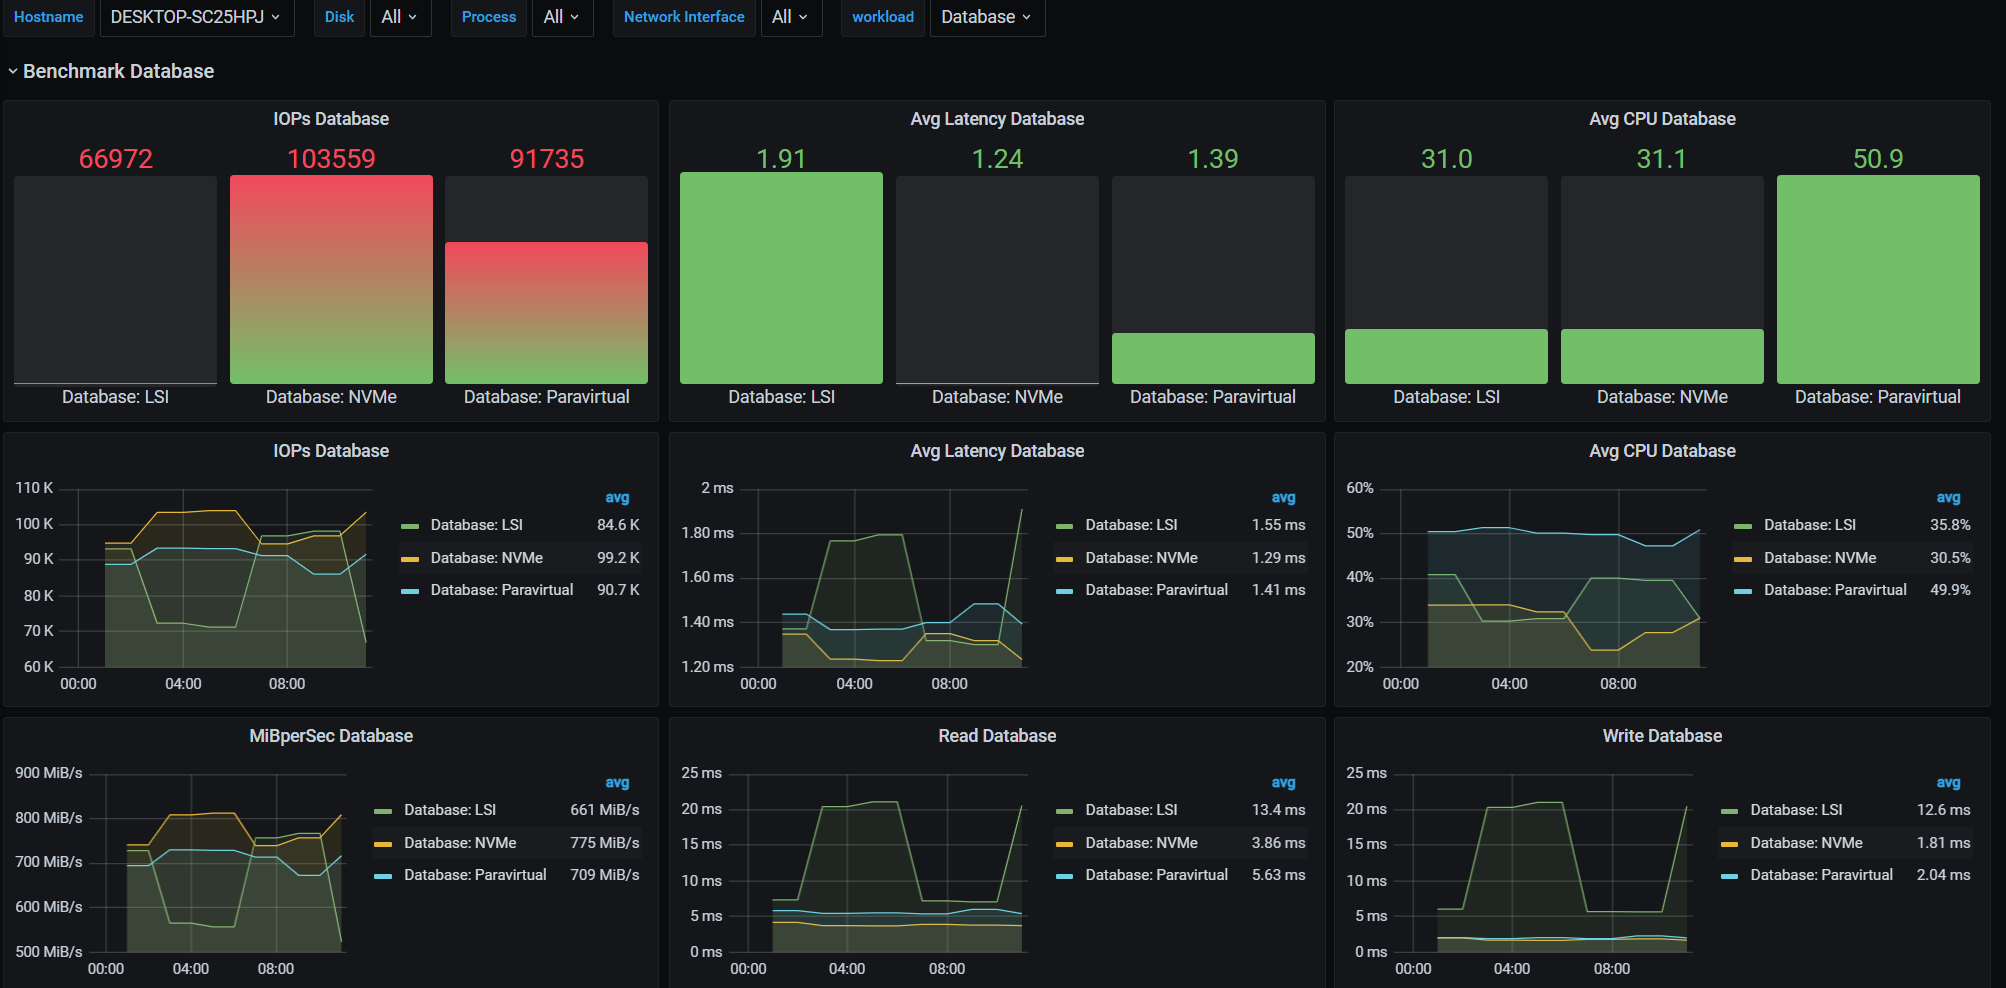
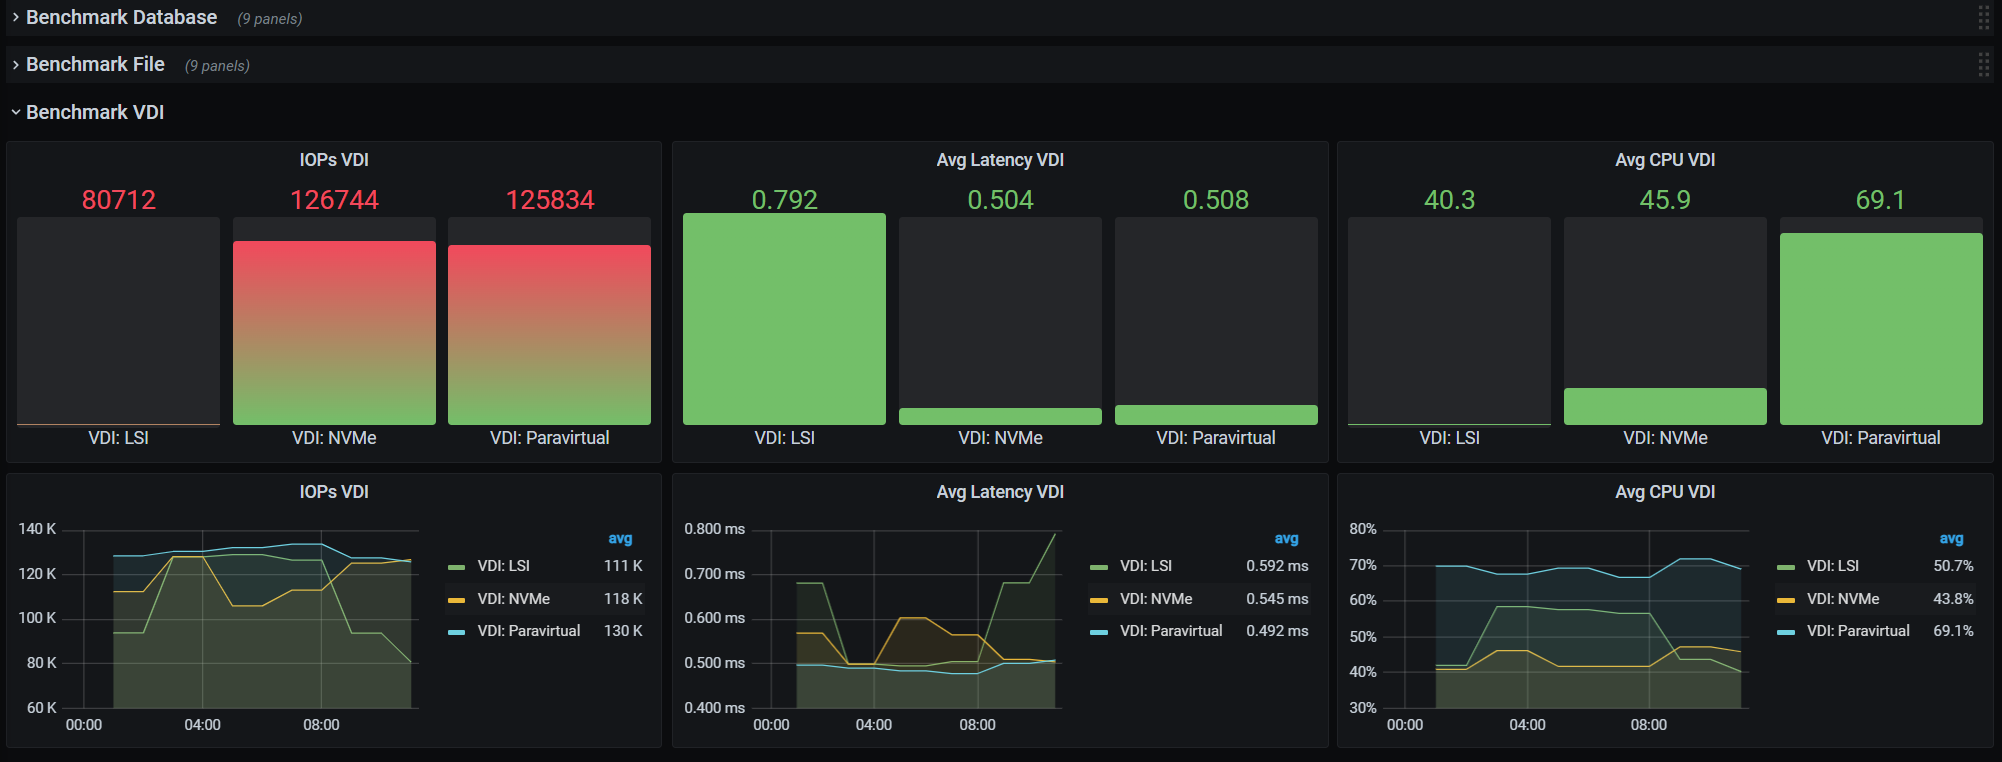
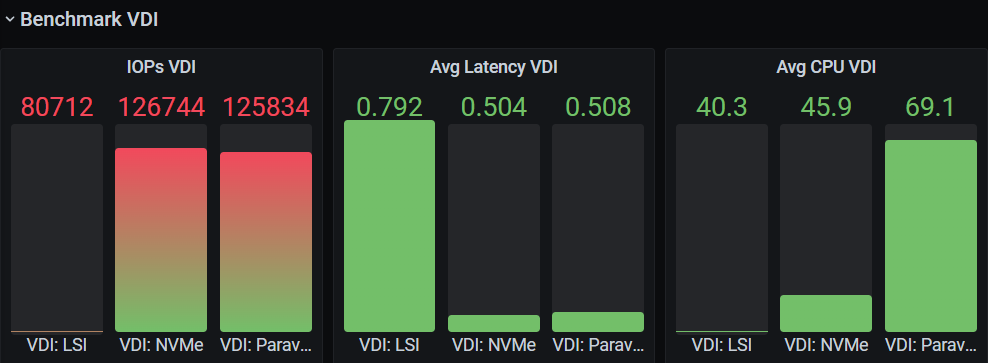
You can also use Opvizor to create charts that provide visual representations of this data and help you gain a more thorough understanding of your disk performance tests.

Analyzing results with Opvizor
You can use Opvizor to analyze test results and identify issues.
Also you use the trending capabilities of Opvizor to help you plan for future disk performance needs and predict future disk performance based on historic data. The nice part of having metric data over time is, that it can be used to benchmark and profile storage tiers, storage classes or disk and RAID controller.

Conclusion
Disk performance tests are crucial for any IT infrastructure monitoring and maintenance strategy. Automating and monitoring disk performance over a longer period of time provide you greater visibility for planning, anomaly detection, and of course load that only occurs at certain times.
Diskspd provides a powerful, flexible, and easy-to-use load test tool, while Opvizor offers comprehensive monitoring and analytics capabilities.
Together, they make it easier than ever to automate and monitor storage and disk performance and ensure that your IT infrastructure is running as efficiently as possible.
