Trends show that more companies prefer cloud services over the self managed on-premise stacks. Being in cloud definitely takes off the shoulders significant part of infrastructure management and allows to put more focus on the software that you run. Running the infrastructure in cloud sounds cool and it can bring several benefits like less maintenance effort, on demand scaling whenever needed as well as a set of easily accessible auxiliary services ready to serve in minutes and so on.
When thinking about monitoring of your cloud infrastructure it might be a challenge due to traditional monitoring techniques not anymore being applicable as most of the cloud managed services will not allow you to access the underlying operating system. It will be even more challenging when running the infrastructure across multiple cloud providers.
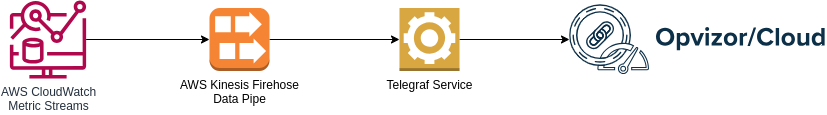
Opvizor/Cloud brings the AWS Integration to show the insights of AWS managed services including the Serverless stack. There should be no single component in your infrastructure which lacks monitoring so in this post we describe how you can enable integration with AWS easily. The setup process can take around 10 minutes if you have some core infrastructure things set already but let's go step-by-step.
AWS Opvizor/Cloud Metrics Pipe
Opposite to most of the integrations we use push technique from AWS end to collect the metrics so we don't need credentials to your AWS account.
The Setup
To setup the AWS metrics pipe we guide you through the following components. Note the order:
- Telegraf agent
- AWS Kinesis Firehose
- AWS Cloudwatch Metric Streams
Telegraf Agent
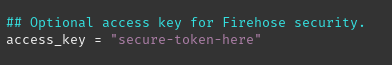
Setup Telegraf service with the provided telegraf.conf configuration from Opvizor/Cloud Integrations page.
Make sure to adjust the access_key for secure authentication from AWS Firehose.
Telegraf agent can be retrieved and installed with the following command lines
wget https://dl.influxdata.com/telegraf/releases/telegraf_1.27.3-1_amd64.deb
sudo dpkg -i telegraf_1.27.3-1_amd64.deb_amd64.deb
sudo cp ./telegraf.conf /etc/telegraf/telegraf.conf
sudo systemctl enable telegraf
sudo systemctl restart telegraf
There is a screen cast available for your ease of setup.
Note that AWS Kinesis Firehose data stream requires secure endpoint as destination therefore a valid TLS certificate must be set for the telegraf service.
Additionally it is not possible to point the AWS Kinesis Firehose to send metrics to a destination endpoint with port other than 443. To overcome this you can setup a port-forwarding using for example socat and enable it as a system service
[Unit]Description=Telegraf 443 to 2443 port forwarder
[Service]Type=simpleStandardOutput=syslogStandardError=syslogSyslogIdentifier=telegraf-forward
ExecStart=socat TCP-LISTEN:443,fork,reuseaddr TCP:127.0.0.1:2443Restart=always
[Install]WantedBy=multi-user.target
Copy/Paste the above service manifest to /etc/systemd/system/telegraf-forward.service
Then enable and start the service by executing the following command lines
sudo systemctl enable telegraf-forward.servicesudo systemctl restart telegraf-forward.service
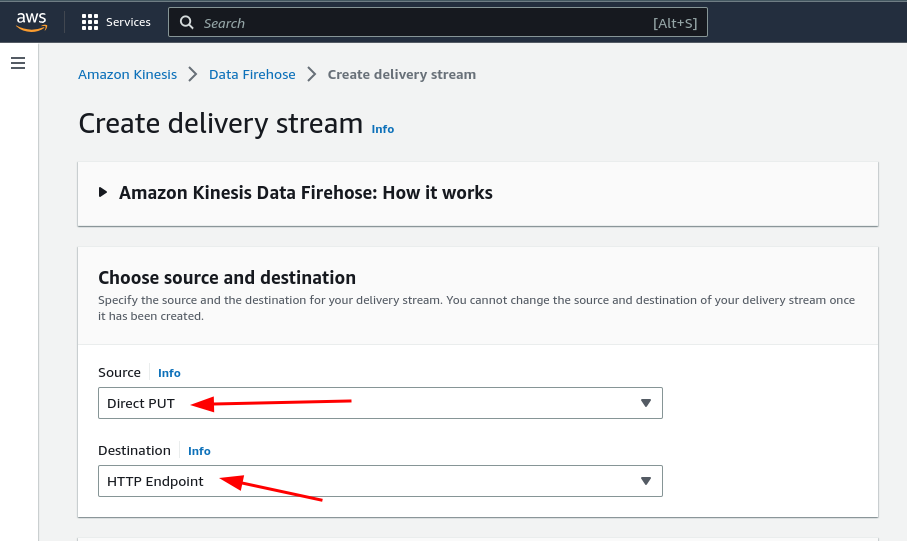
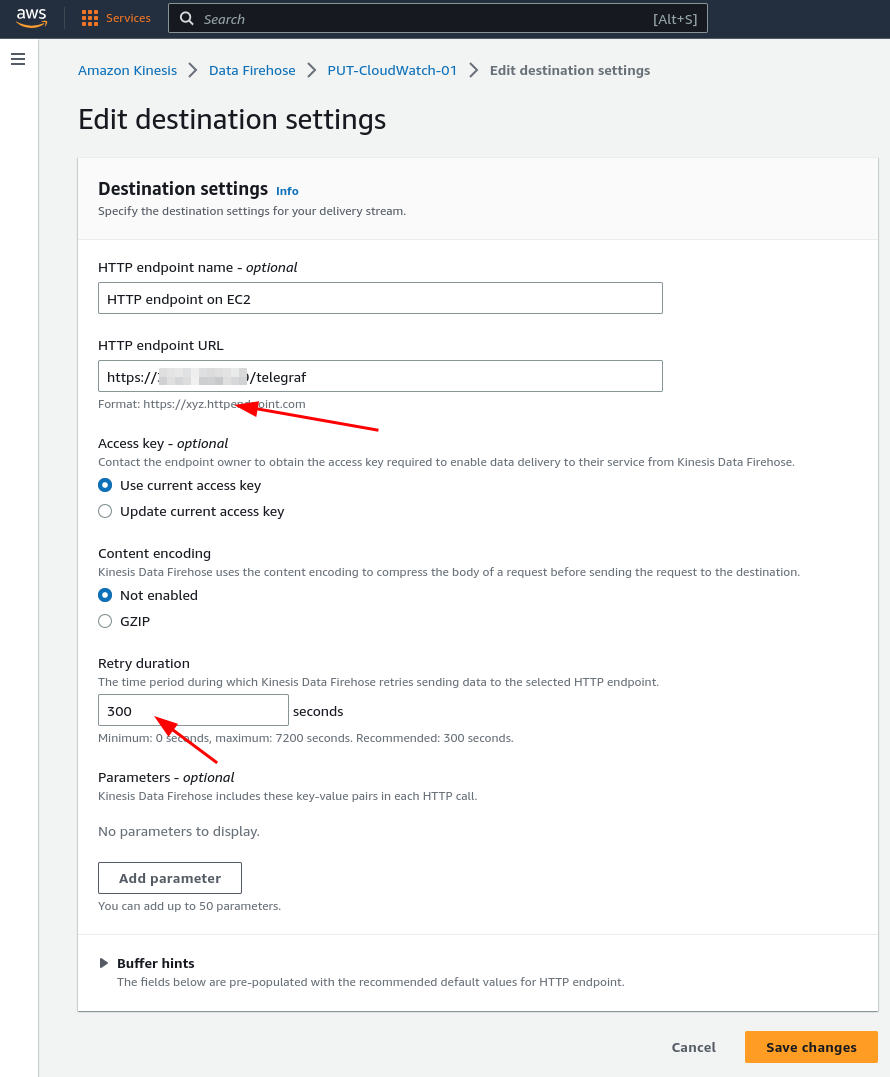
AWS Kinesis Firehose
AWS Kinesis Firehose will be a proxy to pipe through metrics from the AWS CloudWatch Metric streams to the destination Telegraf agent.
Set the source and destination type for the data pipe
Adjust the destination settings
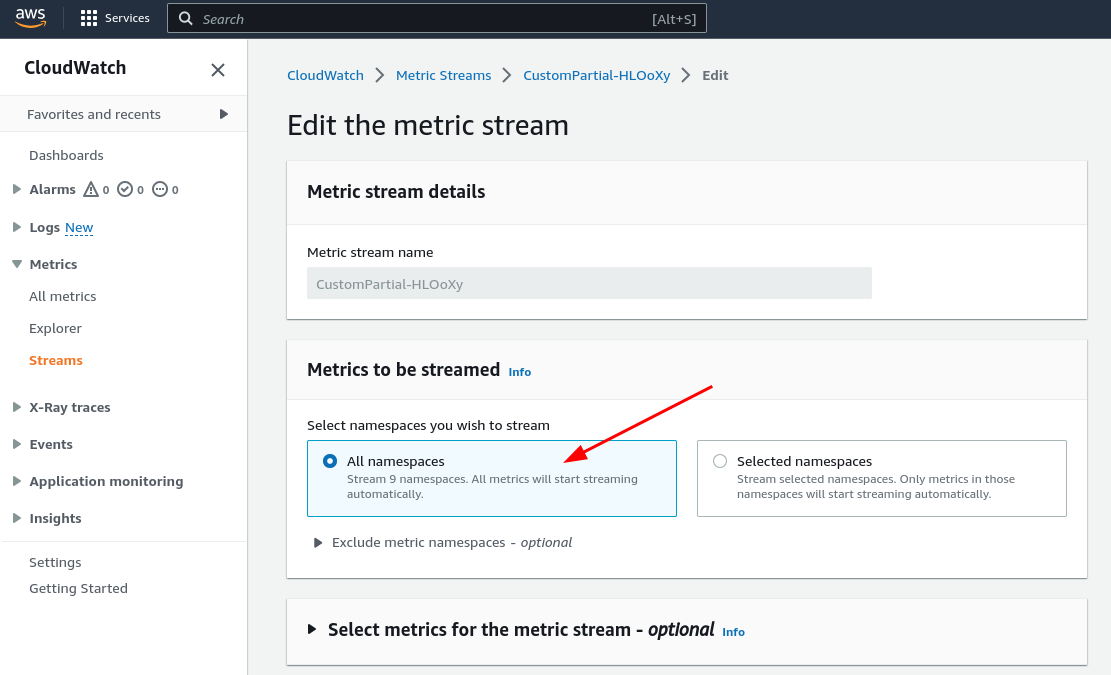
CloudWatch Metric Streams
This is the place where all of your cloud metrics land in the first place. Please be advised that some services like AWS Billing deliver metrics only once a day.
Note that metrics can be region specific so you will need to repeat the setup of AWS Kinesis Firehose and CloudWatch Metric Streams per every region where you operate.
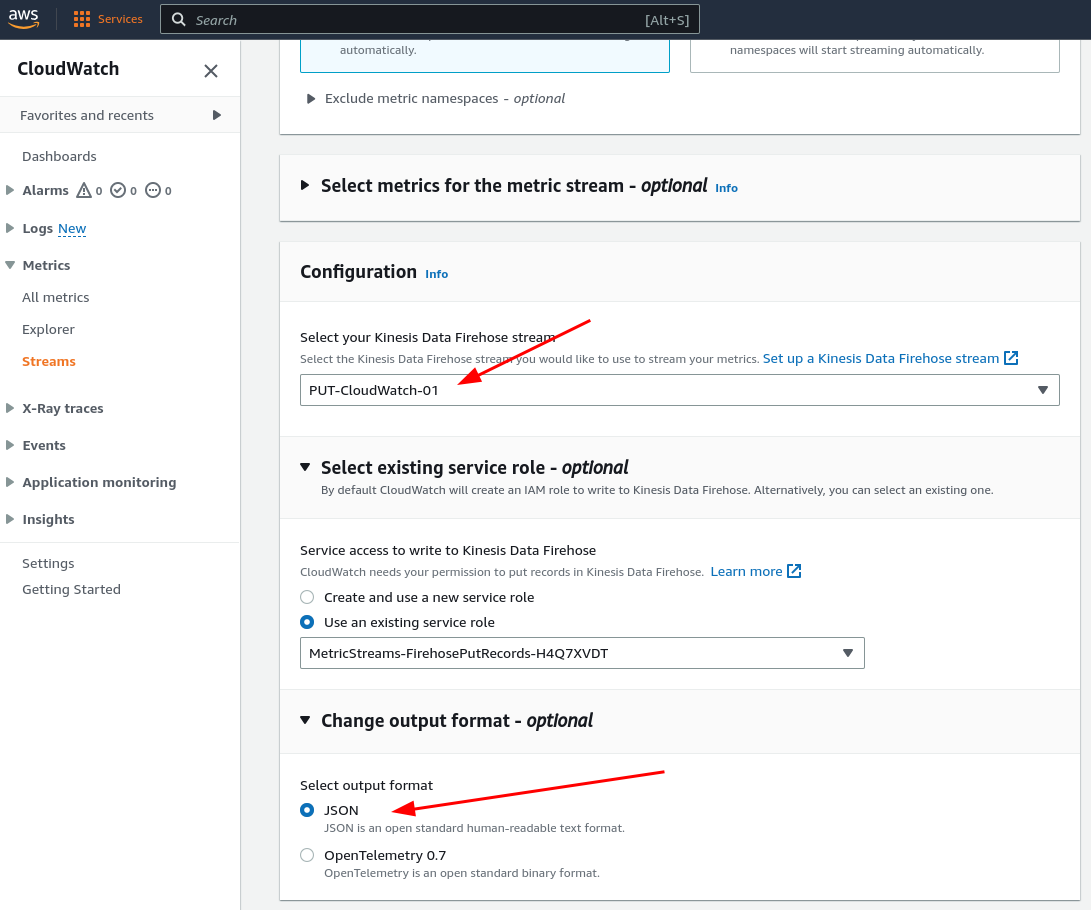
We recommend enabling streams for all available metrics however it is always up to you to choose what metric namespaces are selected.
Finally choose the AWS Firehose data pipe as destination and set format of metrics to JSON.
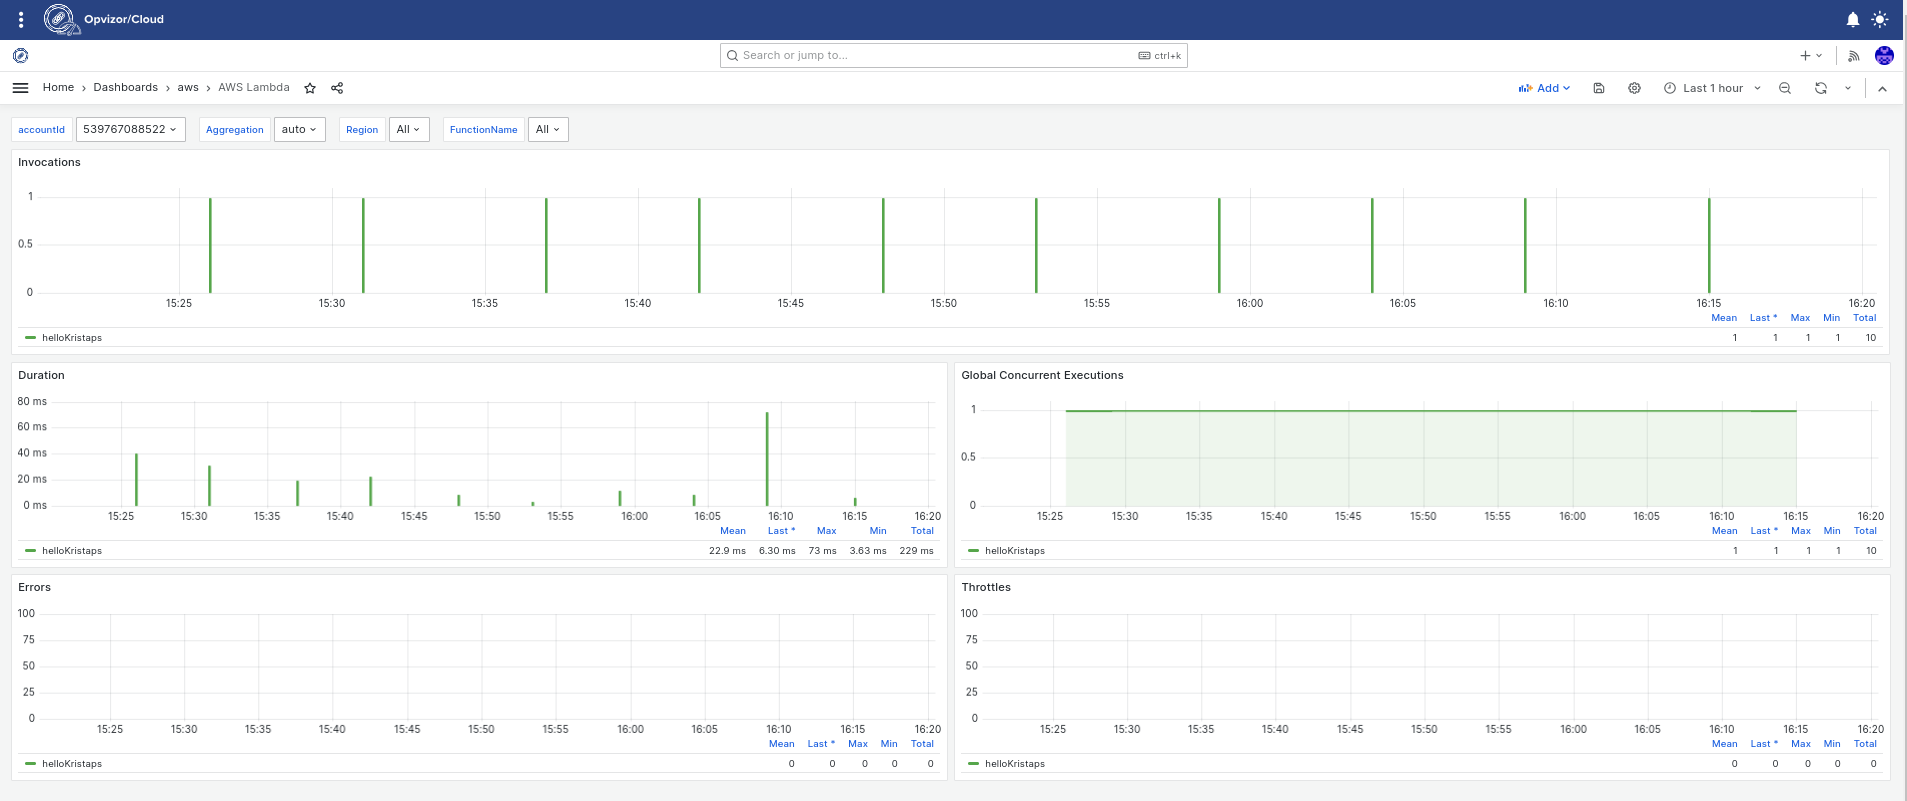
Browsing the dashboards
Once your are done with the configuration allow it to run for 5 - 10 minutes. Then you can start to look at the AWS dashboards.
AWS Lambda
Serverless engines are easy to setup, seamless to run and scale but can be tricky to monitor.. Well not anymore with the Opvizor/Cloud. Your function execution events, duration and errors if any are all there.
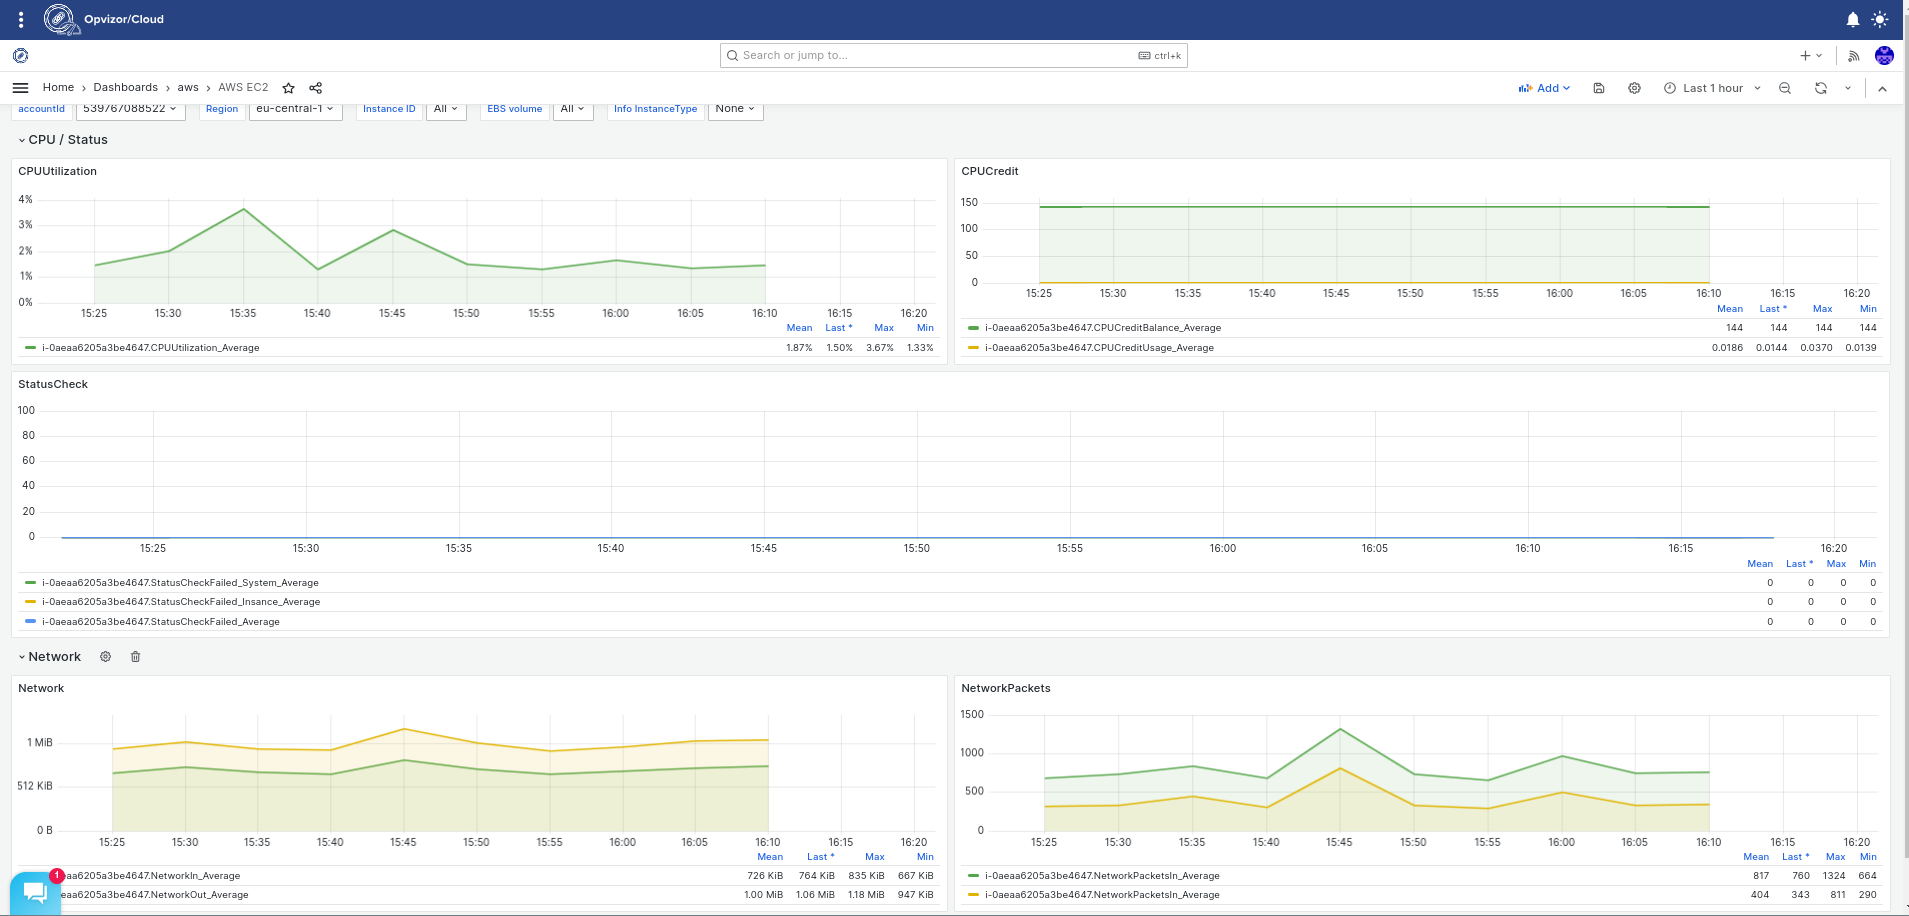
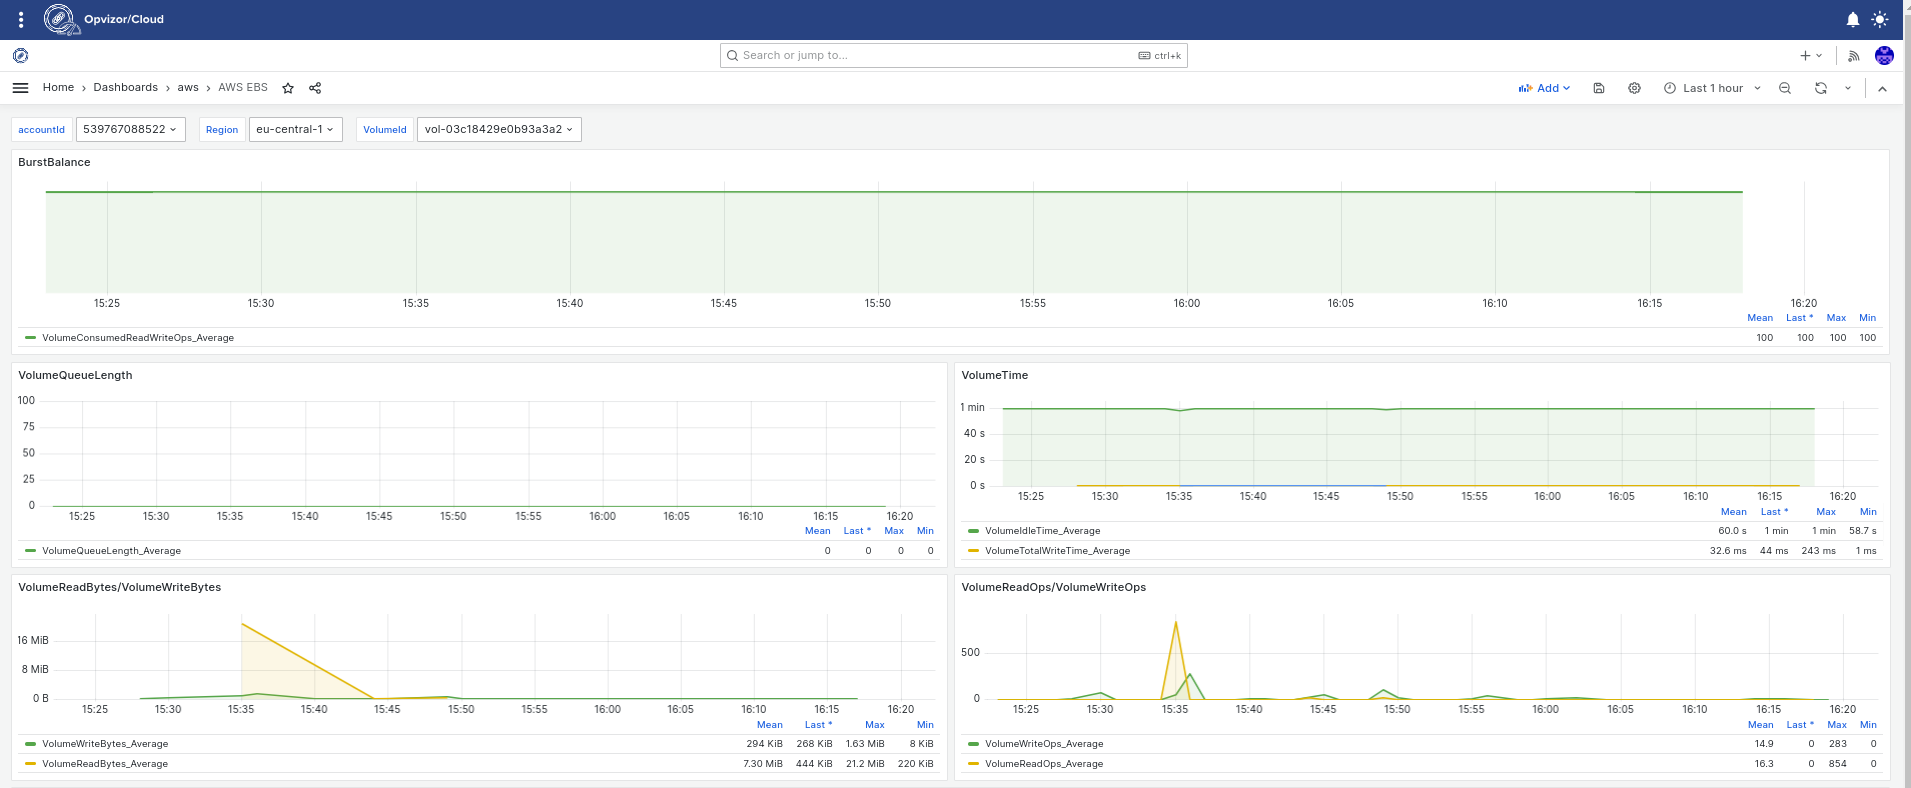
AWS EC2 and EBS
You get all in one with AWS EC2 and EBS dashboards - resource monitoring, network and attached storage volume data is available.
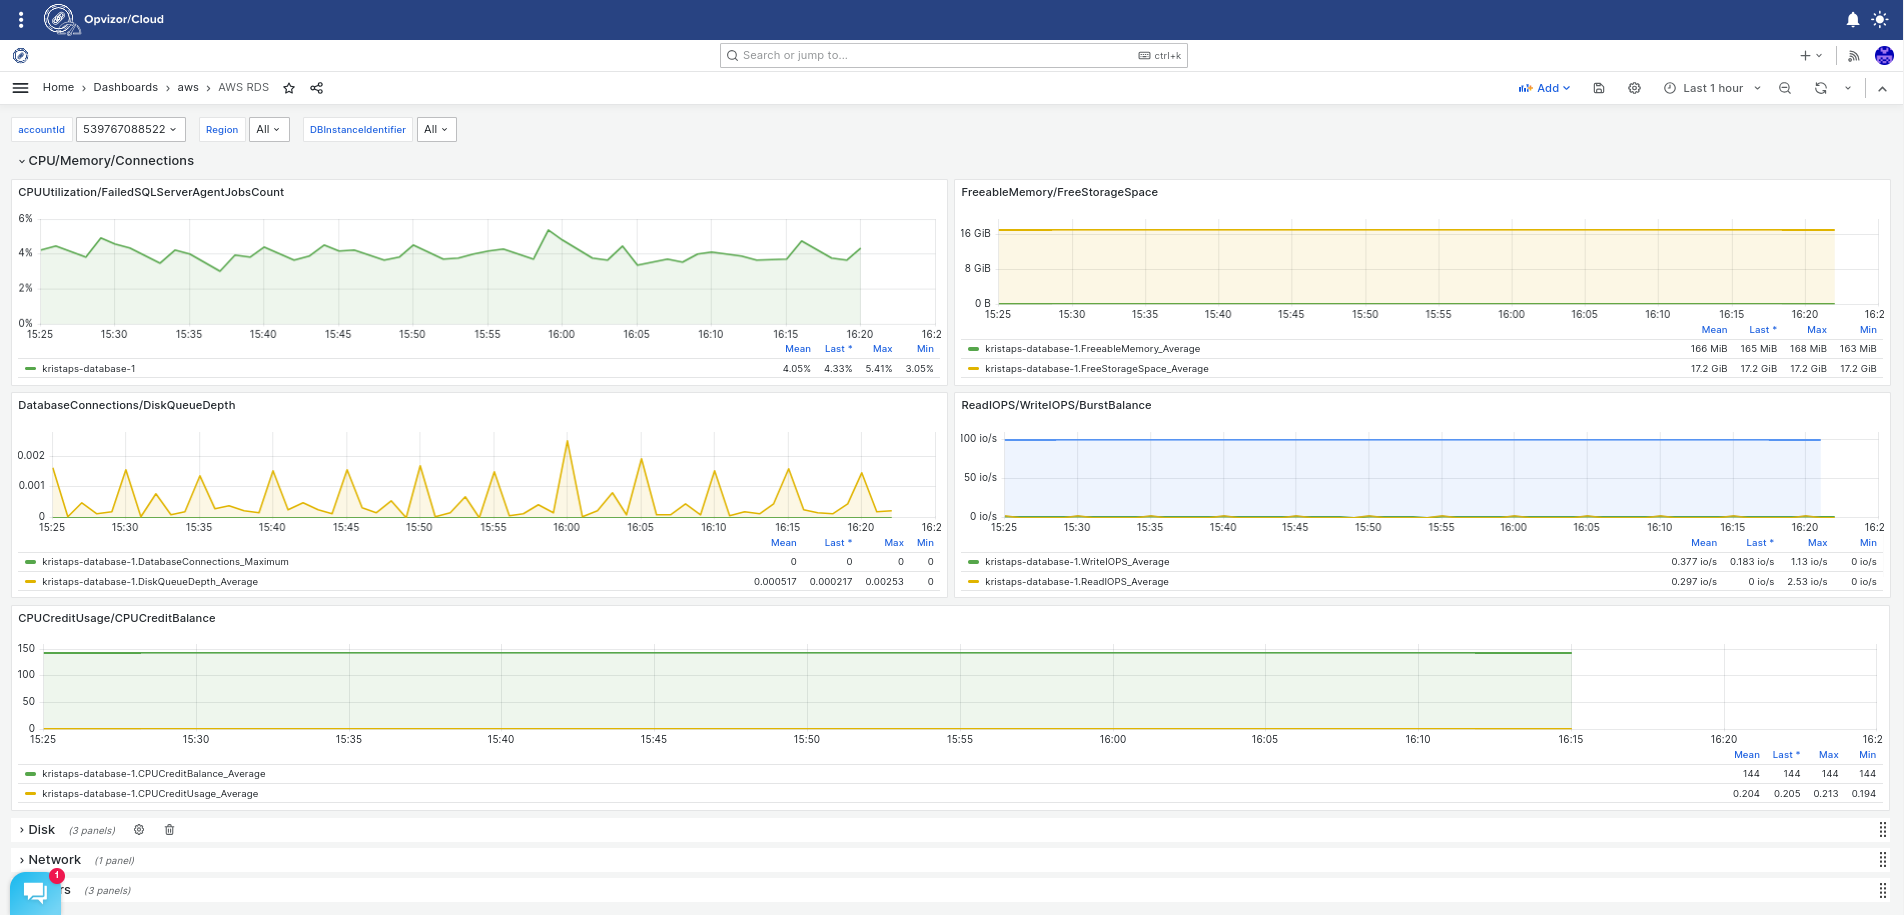
AWS RDS
Running AWS managed databases is a breeze so should be the monitoring as well and indeed there is no a single obstacle to bring it to you with the Opvizor/Cloud AWS Integration.
Conclusion
This is just the beginning of Opvizor/Cloud offerings for connectivity with major Cloud providers. We continuously work on adding more dashboards and bringing more metrics to you daily.
Look into the Opvizor/Cloud Integrations do see what fits best for your infrastructure. Run all of the integrations and have a decent monitoring in one place.
Opvizor/Cloud starts at $58/month per ESXi host with volume discounts available.
To learn more about Opvizor/Cloud, visit https://opvizor.com/cloud or directly sign up at https://cloud.opvizor.com.