Opinions about the way how things look vary. Some will go for a nice looking car while others will choose their next vehicle based on practicality. We think that both sides matter and we live with this feeling all the way when creating each additional view for your infrastructure on Opvizor/Cloud.
Overall look, color contrasts, type of a visualization as well as size of the numbers make difference. Even the tiniest detail matters and help to notice the needle in a haystack and that is exactly what is important when monitoring your critical infrastructure.
On our latest refinements of VMware Integration we have refreshed the look for several dashboards. Let's take a look what the new views bring along.
Overview
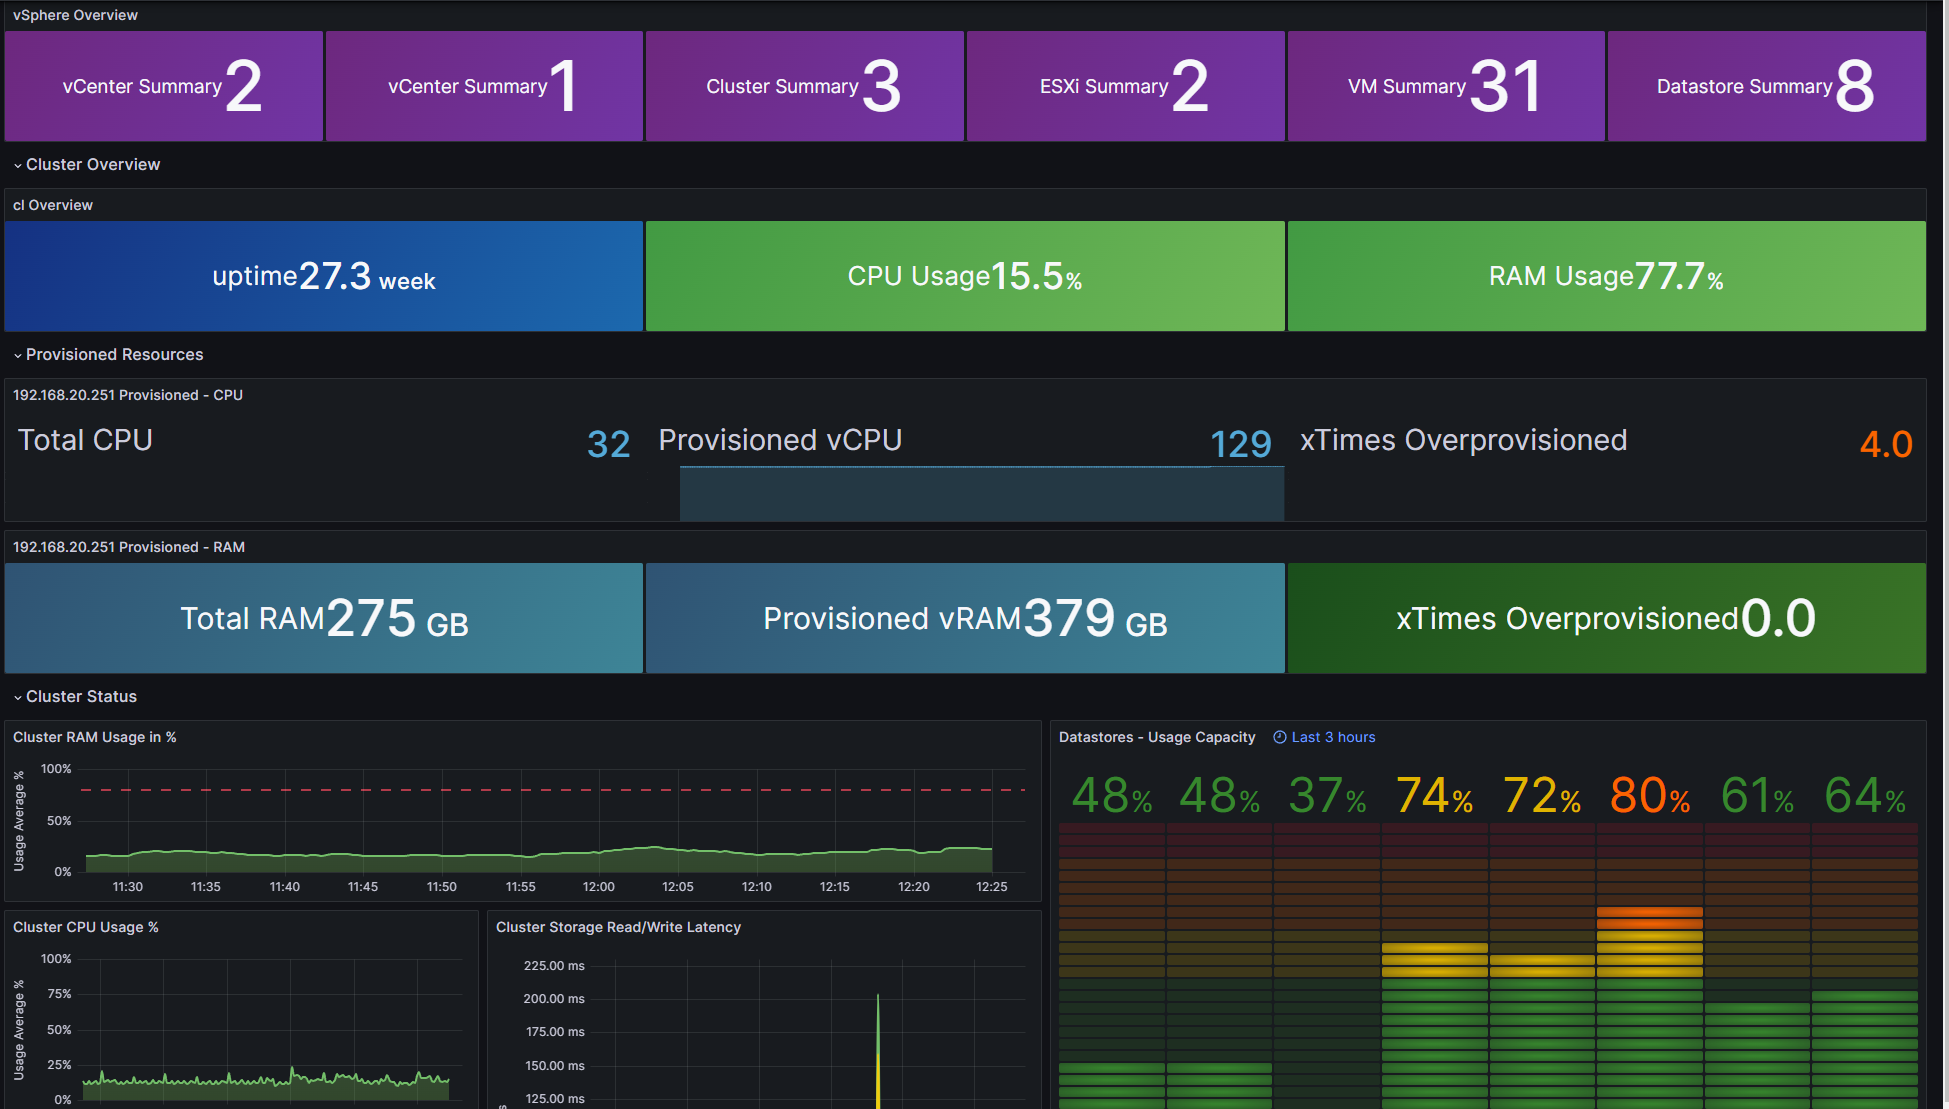
To simplify your daily routine we created a well structured overview with most important metrics at your fingertips. Counters of your vSphere resources are on top following by a resource overview for your clusters.
Additionally you can easily see your provisioned resources and be aware just in case you have assigned more CPU or Memory to your virtual machines than you actually have.
Overall network throughput, read/write latency and there as well. Finally we added a very straight forward view towards the disk usage of your datastores so you can plan your capacity up front.
Hosts
Uptime and resource allocation in multiple different views are available for your ESXi hosts in VMware Hosts dashboard.
.png?width=1688&height=585&name=image%20(13).png)
Datastores
A complete view of your Datastores with clear and easy to understand disk consumption indicators are available in the new Datastores view.
-1.png?width=1692&height=1147&name=image%20(12)-1.png)
Virtual Machines
This dashboard aims to provide a drill down to each virtual machine. Uptime, resource allocation, network throughput, disk latency and more is there ready to present.
.png?width=680&height=404&name=image%20(14).png)
Conclusions
This refresh brings new colors together with simplicity and clear overview on your infrastructure. Additionally all dashboards are equipped with AI support so you can always chat with the metrics and get a full understanding on what you are looking at.
If you are not already on Opvizor/Cloud - check it out right now with 7 days of a free trial.