Monitoring should never be underestimated. The more insights you get the better decisions can be made towards planning of infrastructure resources, scalability and availability of your services to withstand both normal application load as well as malicious traffic generated by attackers.
Opvizor/Cloud enables you to dive deep into your VMware vSphere based infrastructure allowing you to take a look at your infrastructure from many perspectives with 20+ curated dashboards. They further allow you to see the problematic areas, highlight the bottlenecks and proactively plan ahead your infrastructure development.
Let's take a look what it takes to enable the VMware vSphere integration and start your first data ingestion.
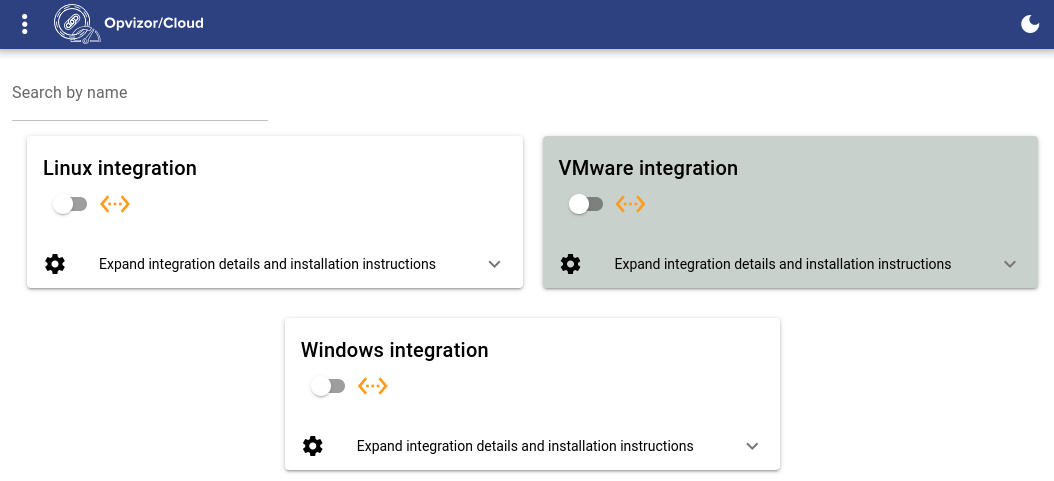
Enabling the VMware Integration
Each integration is equipped with the required configuration. It is ready to be used as soon as you adjust a couple of parameters like endpoint and credentials for your monitoring targets.
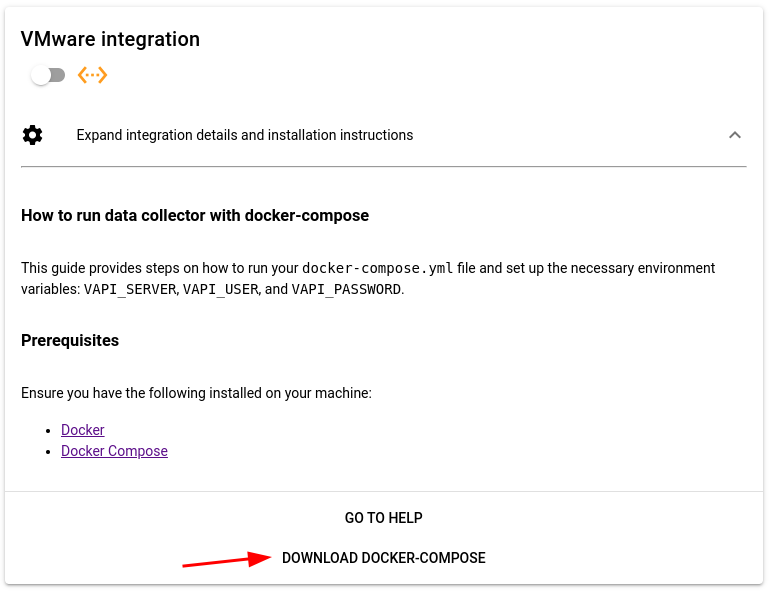
- For integration with VMware vSphere we have prepared an easy-to-use docker-compose file. For installation of Docker Compose please follow the official guide. You should see the required parameters to be adjusted once you download and open it in your editor. An additional optional adjustment is the HOST identifier for customizing your data center's identity in Opvizor/Cloud.
Of course, we encourage you to create a dedicated user account to be used with the Opvizor/Cloud rather than using the administrator's credentials but we will leave that up to you.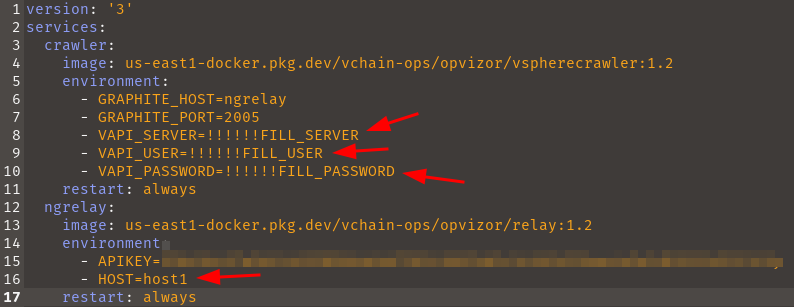
- The startup is as easy as executing a single command in your terminal - be it a Linux or Windows system. See the following screencast how it works.
docker-compose -f ./docker-compose.yml up
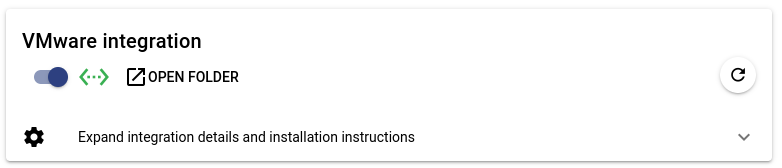
- With a successful startup of the data crawler your are done with the hard part and can head back to the Integrations section and enable your integration Just toggle the switch and you should see in a few moments how the status indicator turns green indicating that the data is being ingested.
Note that it can take up to 15 minutes once the data will appear on dashboards
Exploring the Dashboards
You will find dashboards structured in folders based on integrations and further prefixed with areas of focus like Performance, Capacity, Planning etc for ease of finding what you need. Additionally we have created a few starter dashboards to help get around and they are linked to others so it is a good place where to start exploring.
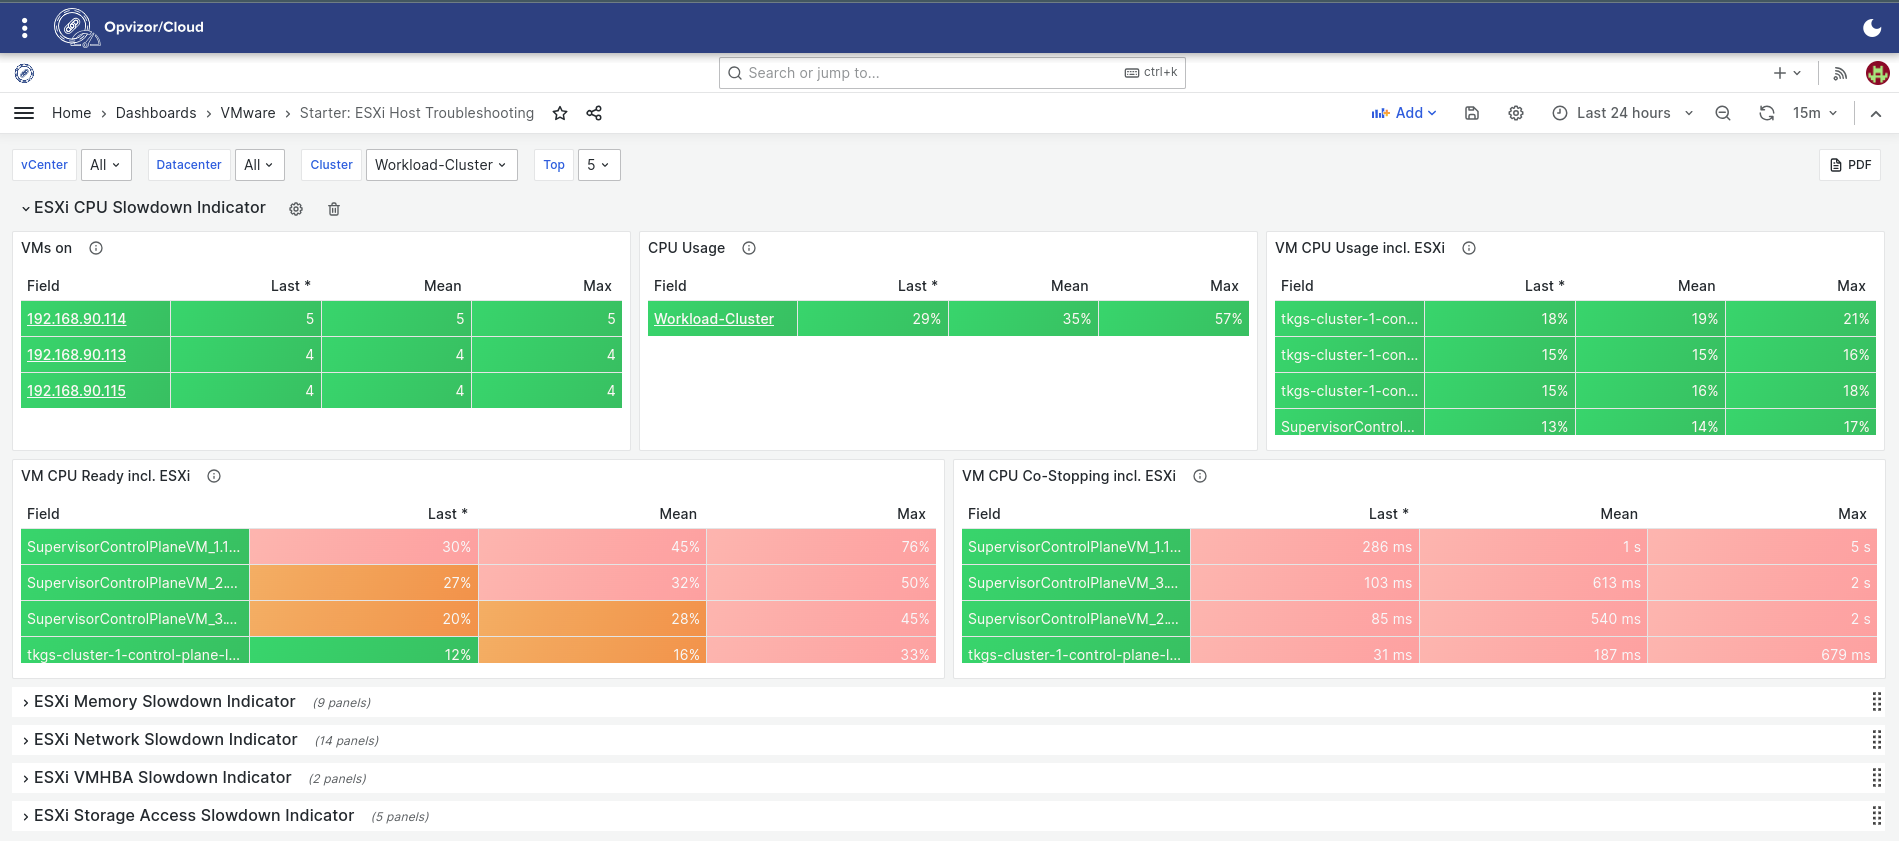
Starters
Starters give you insights on troubleshooting of supervisor instances, data stores and virtual machines. Let's take Starter: ESXi Host Troubleshooting as an example. This dashboard will give you simple enough view on your vCenter setup, allowing to indicate some of the most common issues. Further details are available once you go to linked dashboards by selecting specific host.
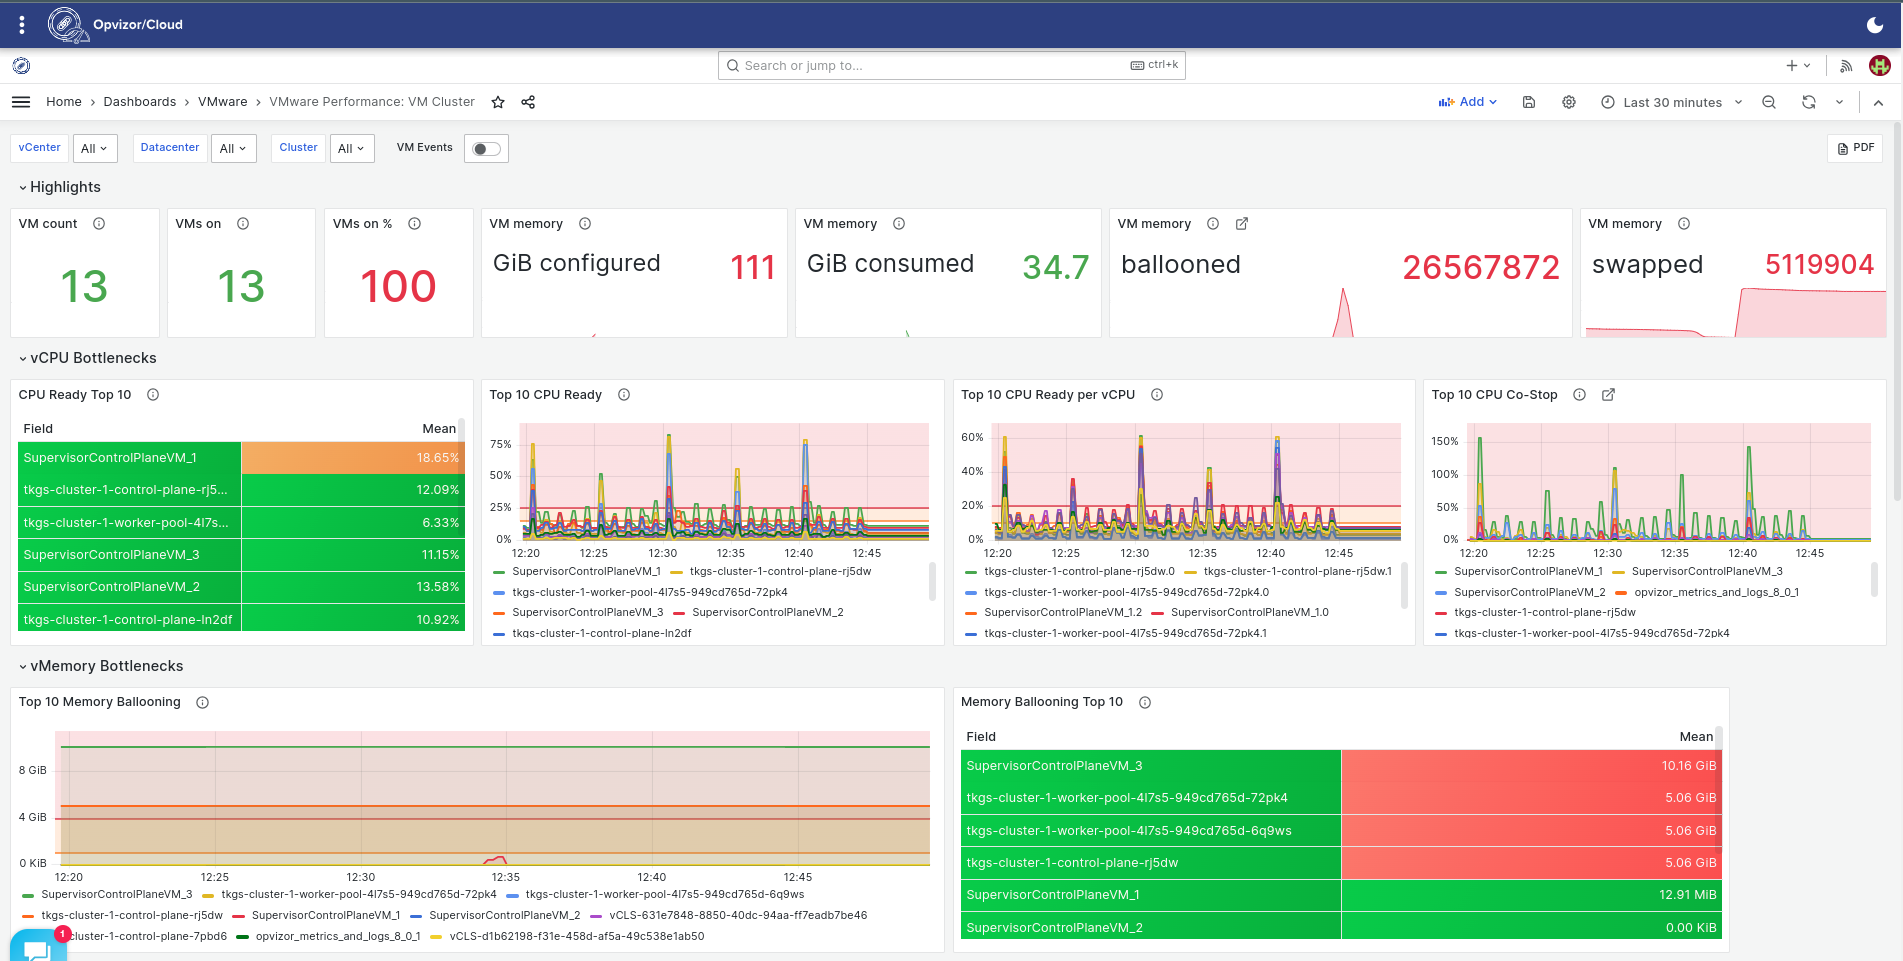
Performance
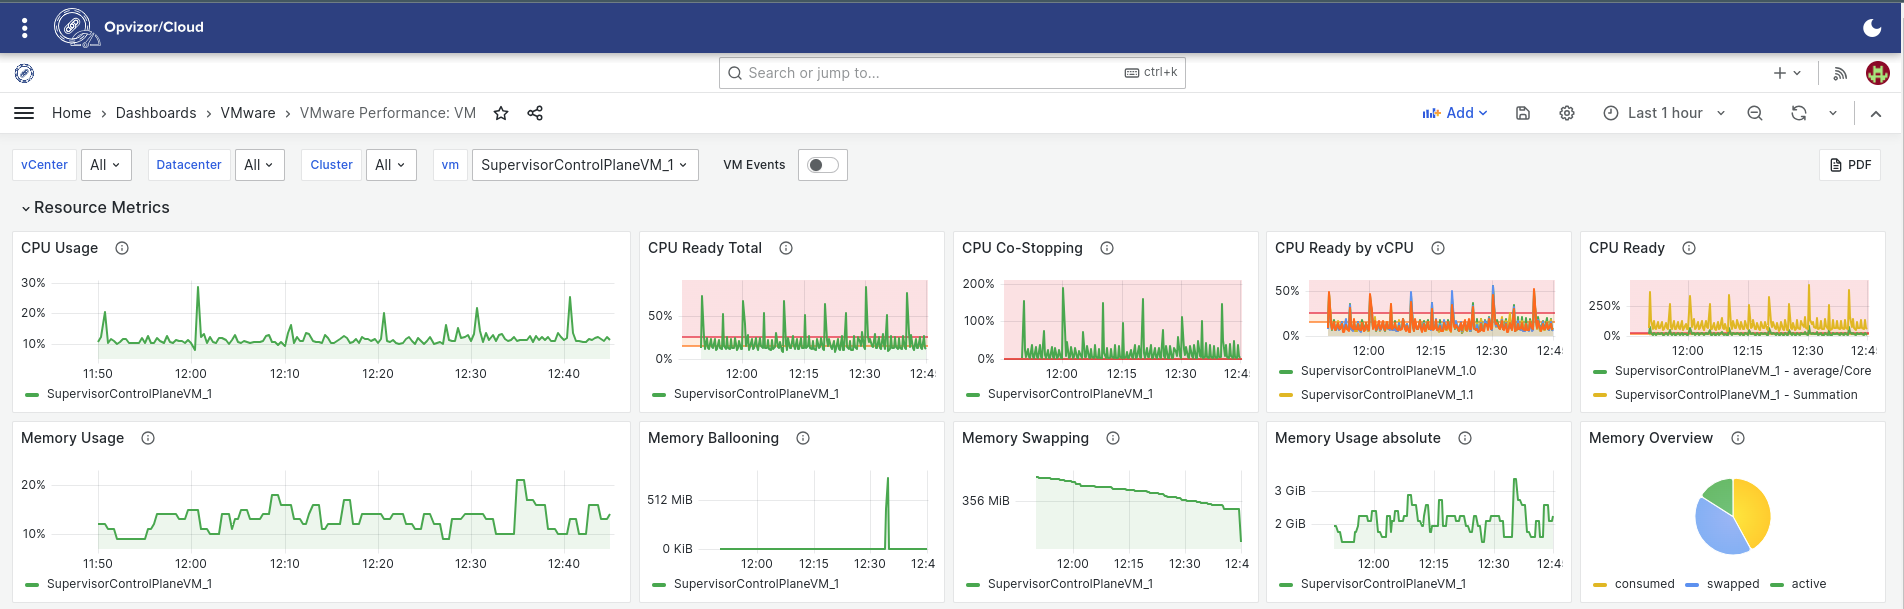
CPU and Memory consumption, Disk and Network metrics, you name it, all of it can be found on Opvizor/Cloud Performance dashboards.
Drill Down to VM Performance Level
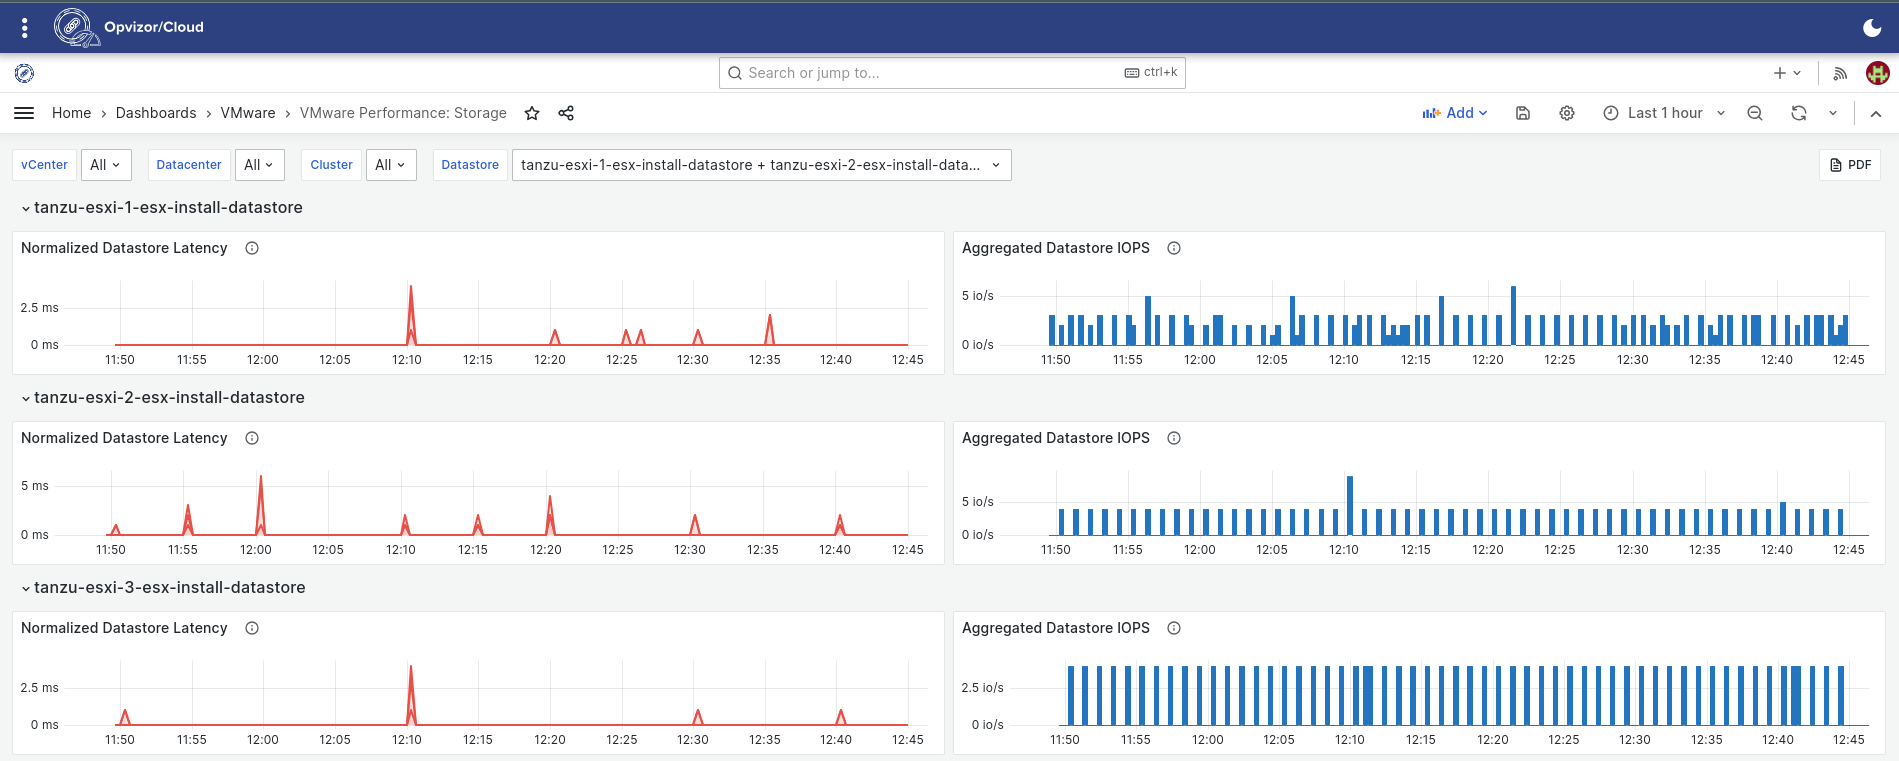
Explore Datastore Metrics
Observe Overall Cluster Health
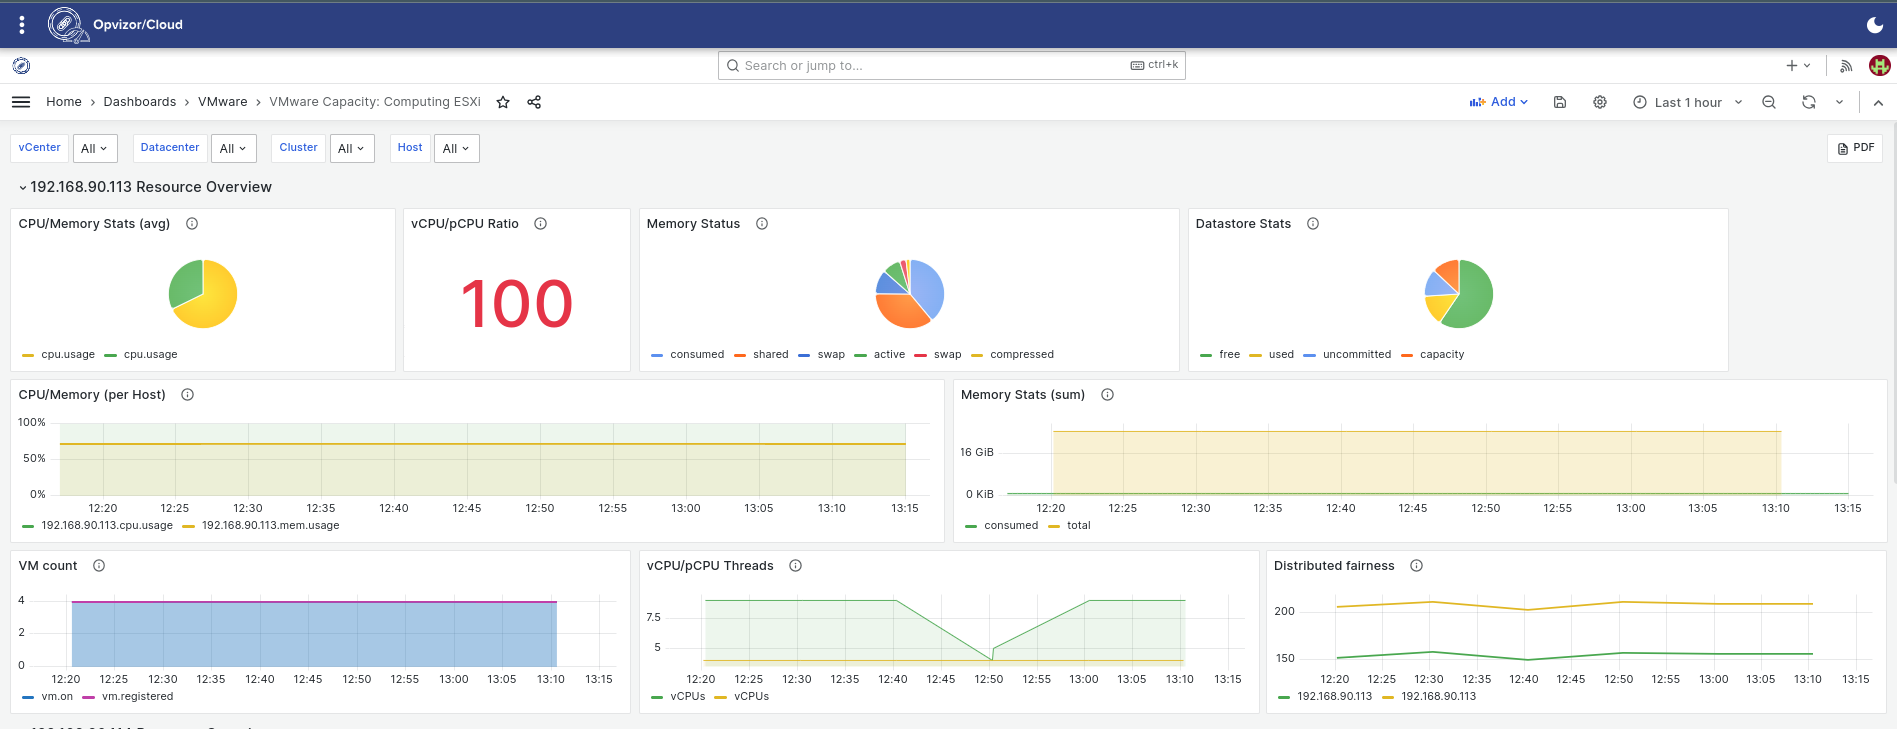
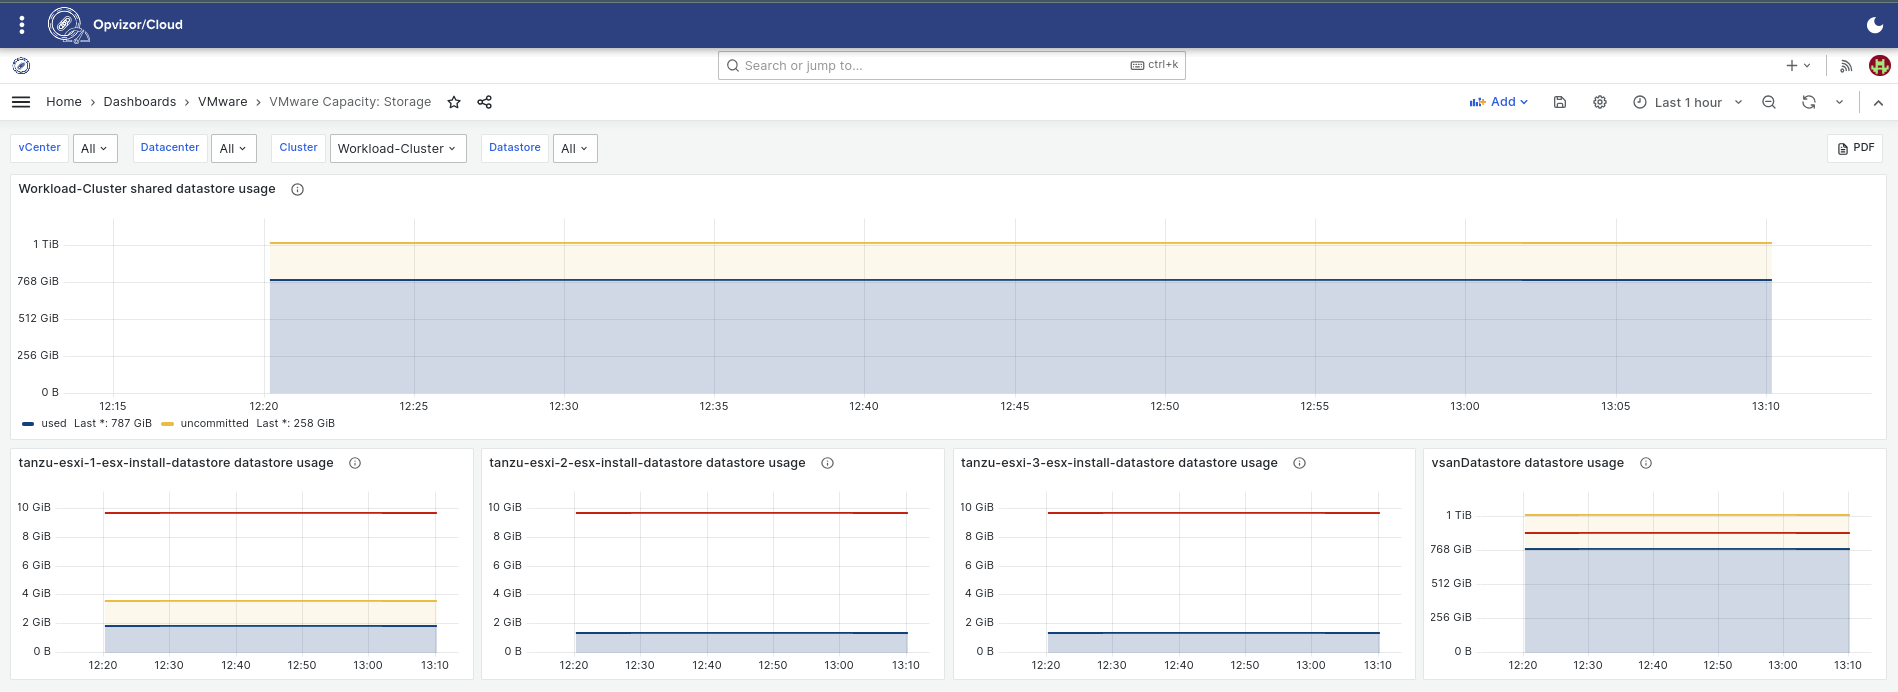
Capacity
Capacity stats are provided at several levels starting with ESXi overview and going to specific resource-related views.
ESXi Overall Capacity Stats
Storage Overview
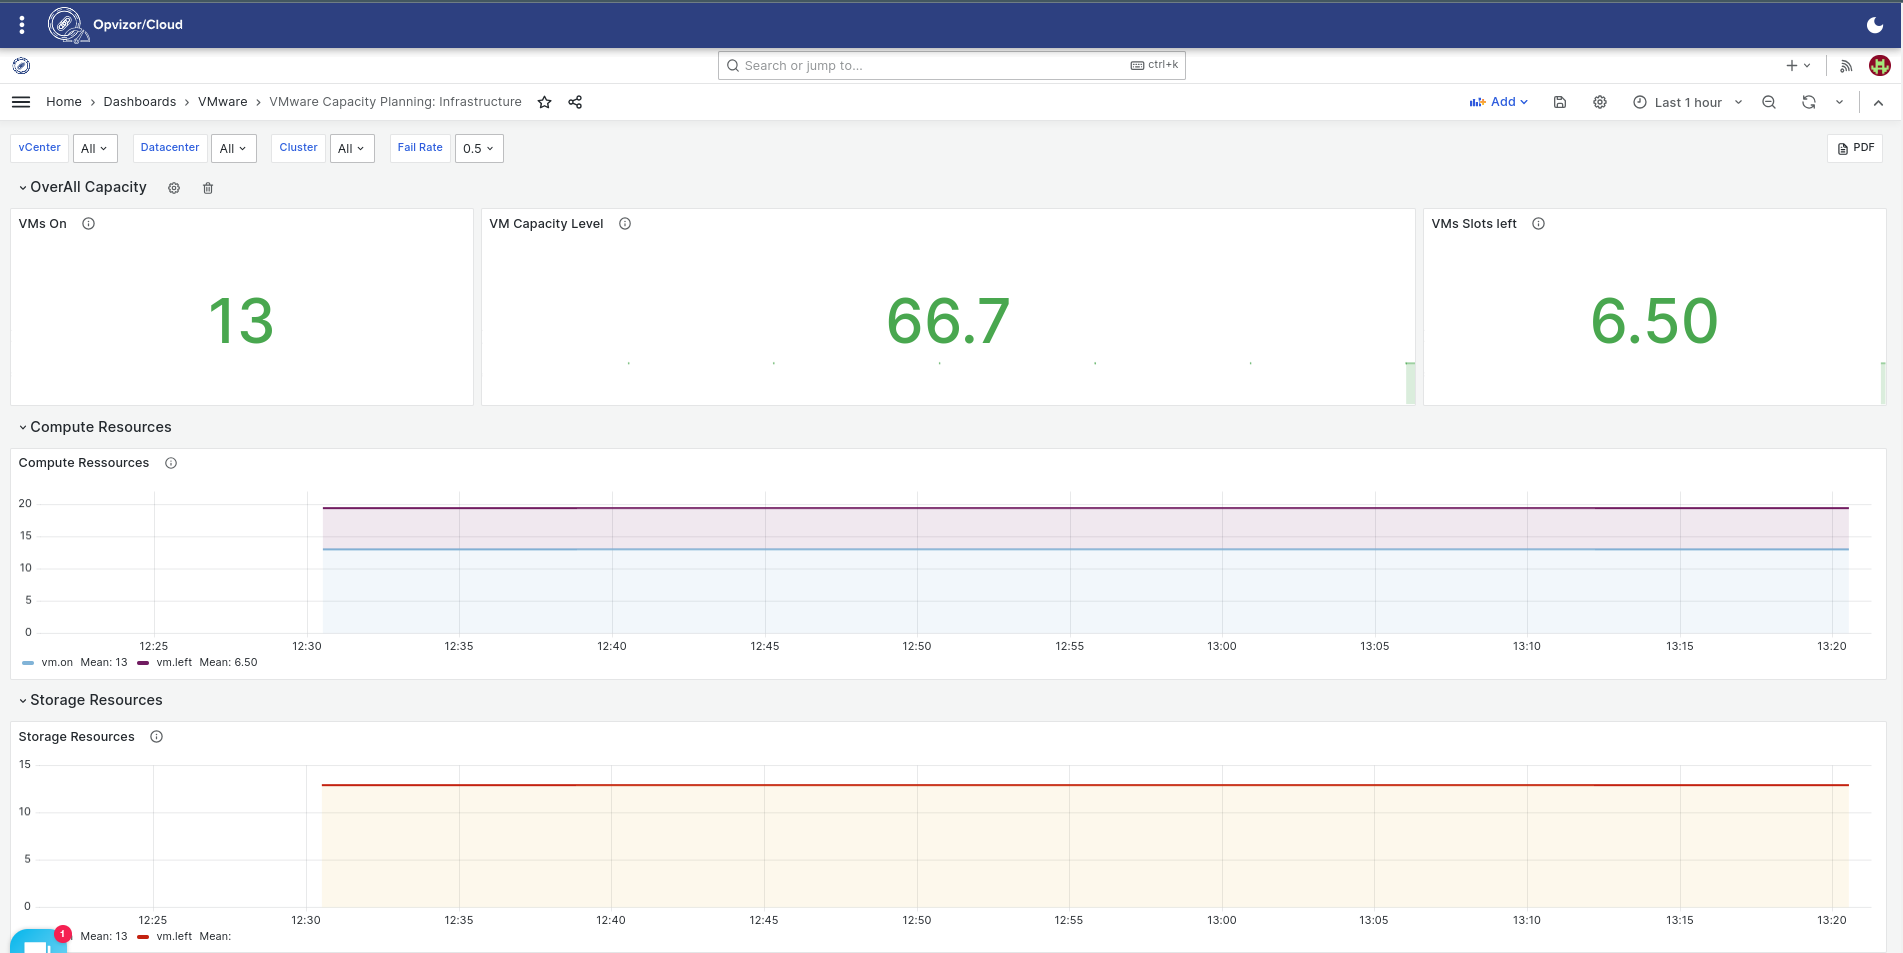
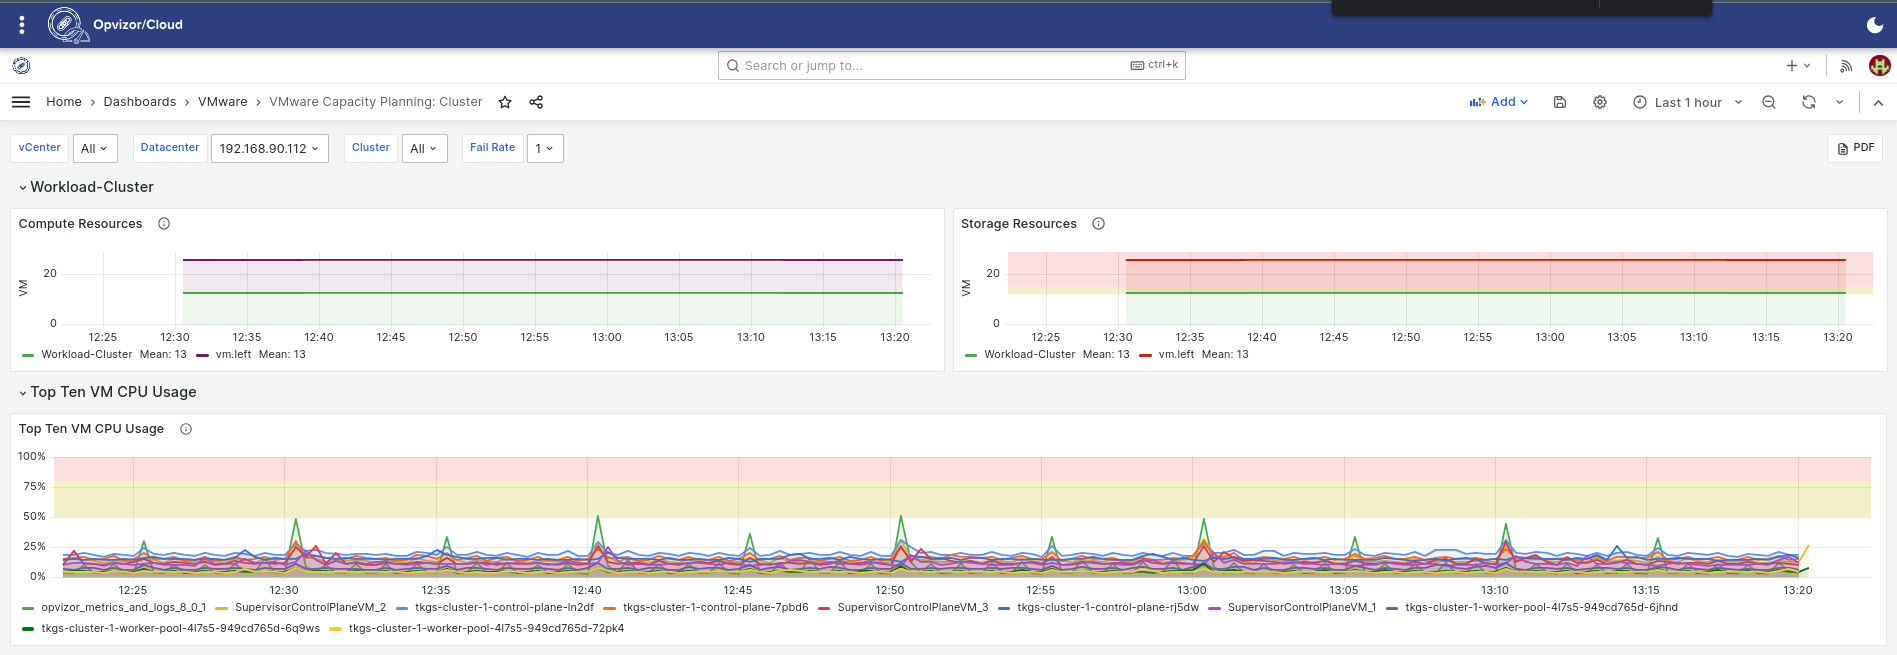
Infrastructure Planning
Planning-related dashboards indicate where your clusters stand in terms of resources. This helps to calculate up front to make scaling up easy and precise.
AI Enabled Explanations
Having dashboards is nice but you need to fully understand them in order to get all of the benefits and that can definitely be a challenge. Opvizor/Cloud brings AI capabilities allowing you to chat with the dashboards.
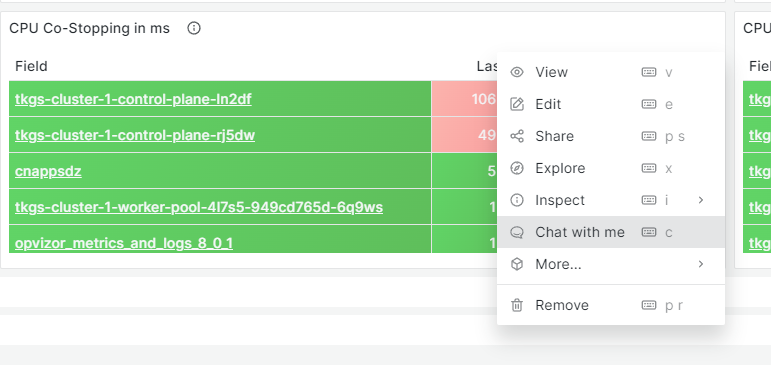
Ask a question and it will get answered immediately giving you a detailed explanation on any metric, value, behavior what might be unclear.
.png?width=1398&height=952&name=Image%20Pasted%20at%202023-7-7%2012-38%20(1).png)
Conclusions
Opvizor/Cloud enables integrations with your infrastructure easily and provides just what you need to get you on top of your workloads. Opvizor team is continuously working to improve the metric visualization, to make them as meaningful as possible, and to bring in new insights. As a result, the dashboards are integrated and delivered to you in a seamless way.
Opvizor/Cloud starts at $58/month per ESXi host with volume discounts available.
To learn more about Opvizor/Cloud, visit https://opvizor.com/cloud or directly sign up at https://cloud.opvizor.com.