We received several customer requests to support Linux and Docker running on IBM S/390 architecture. The goal was to see all important linux performance and resource usage metrics for the parent system as well as the docker container environment. All should run in docker container, so no additional installation was required.
As you can imagine it didn´t took us long to accept that challenge and we want to share the results with you.
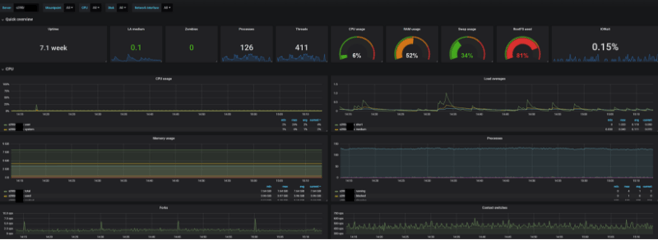
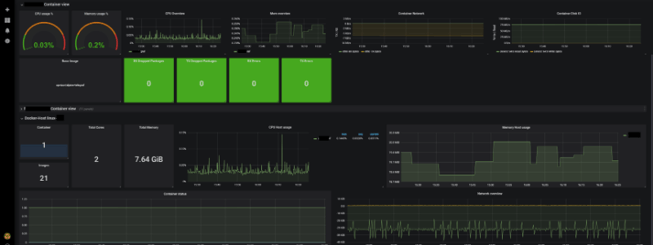
Maybe a little teaser … what you can expect, when following our blog post.
Oh just in case, you wonder why people ask for IBM S/390 support:
S/390 is IBMs most reliable hardware platform. S/390 servers can be partitioned and run different operating systems, separated from each other, at the same time.
Linux brings the power of Open Source software and tools to the S/390 mainframe. All the current versions of standard Linux tools and software can run on a Linux partition gaining the advantages of mainframe hardware.
https://en.wikipedia.org/wiki/Linux_on_z_Systems
The IBM S/390 architecture
To be honest, the different architecture was the only real challenge for us, as we knew ones the data collectors are up and running, we can display everything in a beautiful and helpful dashboard. Our ultimate goal was to automate the collection of Linux for S/390 performance metrics in a central time series database to be visualized in Performance Analyzer. All required components are part of the Opvizor Performance Analyzer virtual appliance – so no worries.
The only missing part was the data collector to run on IBM S/390 architecture.
Telegraf data collector for IBM S/390 architecture
https://github.com/influxdata/telegraf/releases
That is the multi-platform beauty of the Go language: as the data collector we chose for Linux Telegraf is written in Go, there is already a package ready for s390x architecture.
So we just need to package it nicely within a docker container to run taking these steps:
- create a Dockerfile based on a small container OS supporting s390
- create a config file to be used by telegraf to be mapped into the container
- create a startup script that runs telegraf when the container spins up
To make your life easier, we published the Docker configuration here: https://github.com/opvizordz/patelegraf
We chose Alpine linux for the container as its very lightweight and the resulting container image was just 82 MB in size.
After the creation of the 3 files (if you clone the repository or just copy the files according to our example, you should also have 2 directories, runtime and config) Dockerfile, runtime/start.sh and config/telegraf.conf (btw. we don´t need that one until we run the container), you can build the container.
Btw. please feel free to change the download path of the telegraf version you want to use. Just make sure its Linux and not Debian or Centos.
To create a local docker image you can use without any version tags, just name it latest instead of 1.9.2 (or whatever telegraf version you´re using).
docker build -t opvizor/s390alpine-telegraf:latest .
When no errors show up, you can find that image using docker images
That´s it – image is ready to be tested or used.
Telegraf configuration and first container start
Before starting the container, please make sure that you changed the config/telegraf.conf file according to your needs. Opvizor Performance Analyzer customers can always start with our existing linux template files:
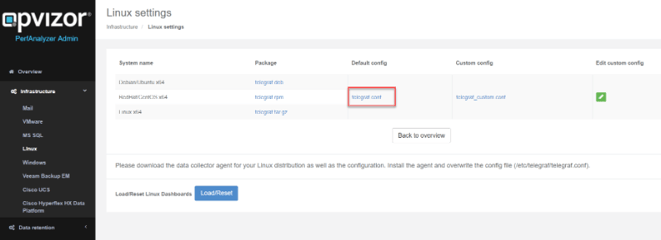
That configuration file container all required data collection and target database information required for the telegraf agent.
If you use your own telegraf config just overwrite the file in config.
Let´s give the container a try run:
docker run -d -v $(pwd)/config:/etc/telegraf –name s390telegraf opvizor/s390alpine-telegraf:latest
That command runs the docker container with the name s390telegraf in the background (daemon) and mounts the local config folder to the /etc/telegraf folder of the container.
If you want the container to be restarted, whenever it goes down without human interaction, just add –restart=unless-stopped to the commandline (before the container image name).
Btw. you can also add that attribute to the container while running:
docker update –restart=unless-stopped
docker logs gives you more information about the status of the telegraf agent.
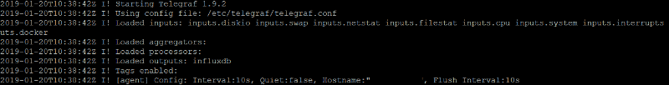
Perfect – all running.
Important: Now the container collects only the data that can be seen from inside of the container, not the host!
Tuning the container for Linux for S/390 performance data collection
2 things are still missing:
- Linux metrics from the host and not the container
- Docker metrics from the host
To achieve that goal we need to customize the docker run command and change the telegraf.conf file that is being used.
Lets start with the content of the telegraf.conf to include docker metrics:
[[inputs.docker]]
## Docker Endpoint
endpoint = "unix:///var/run/docker.sock"
gather_services = false
timeout = "5s"
Please note the path that is used /var/run/docker.sock as that one needs to be mapped into the container.
Important:
Before issuing another docker run command, stop and remove the existing container,
docker stop && docker rm
Now let´s change the docker run command to map all the important host paths to the container and adjust the telegraf runtime environment accordingly.
Here comes the docker run command including some further information:
docker run -d -v $(pwd)/config:/etc/telegraf #point to the config file
-v /var/run/utmp:/var/run/utmp:ro #required to collect host system metrics (read-only mapping)
-v /var/run/docker.sock:/var/run/docker.sock:ro # required to access docker information
-v /:/hostfs:ro -v /etc:/hostfs/etc:ro -v /proc:/hostfs/proc:ro -v /sys:/hostfs/sys:ro # other important host folder
-e HOST_ETC=/hostfs/etc -e HOST_PROC=/hostfs/proc -e HOST_SYS=/hostfs/sys # set environment to match mappings
-e HOST_MOUNT_PREFIX=/hostfs # set environment to match mappings
–name s390telegraf # container name
opvizor/s390alpine-telegraf:latest # container image
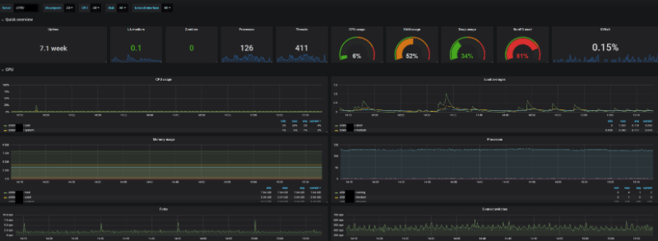
Linux information Dashboard on Opvizor Performance Analyzer
Feel free to use the repository to create you own telegraf image and make use of our 30-day trial of Performance Analyzer. That will save you so much time, to get all up and running – guaranteed!