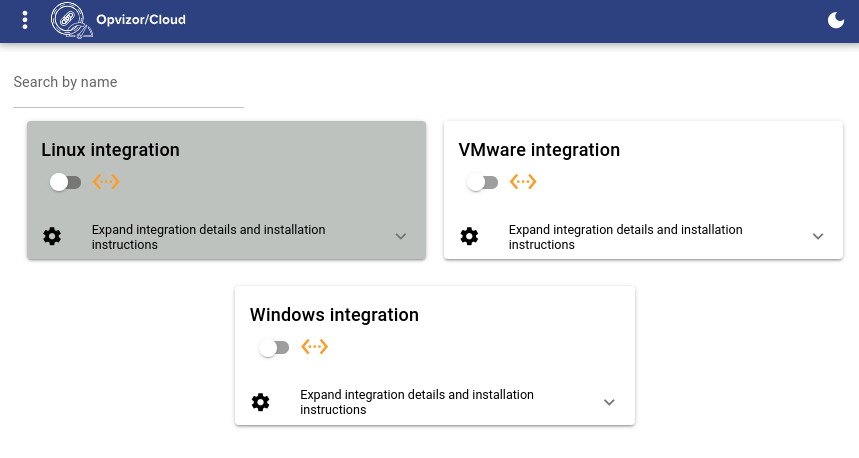
No matter what hypervisor, container solution or cloud provider you use to run your infrastructure Opvizor/Cloud with its Linux Integration can help with resource monitoring.
There is a fair chance that a significant part of companies would have a hybrid on-premise / in-cloud infrastructure for various reasons. Therefore it is always a relief for a setup and a maintenance when one solution can be deployed on several totally different environments. Linux Integration by Opvizor/Cloud gives exactly that - a standardized resource monitoring solution that can be applied anywhere as long as it is running a Linux.
Here we will take a look how you can get started with the Linux Integration in under 5 minutes.
Enabling Linux Integration
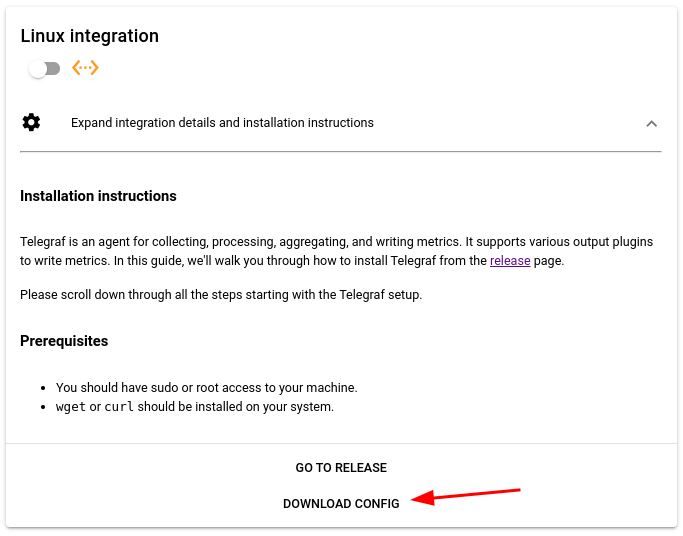
Getting the Linux Integration up and running is extremely straight forward and does not require any additions / adjustments to the configuration at all. By expanding the description you will find all the steps needed so let's take a look what it takes.
- We use a well known Telegraf agent for collecting the metrics and have prepared a ready to use configuration specialized for your account. So the first step is to get the config.
- Telegraf can be retrieved and installed by executing the following command lines on your hybervisor, VM or even as part of your Dockerfile build. The latest release of Telegraf by the time of writing this article is 1.27.1-1 but you can adjust it by checking latest releases on the GitHub project. HINT: In case you are running Ubuntu 18.04, make sure to use a Telegraf version 1.24 and not 1.25 and older.
curl -O https://dl.influxdata.com/telegraf/releases/telegraf_1.27.1-1_amd64.debsudo dpkg -i telegraf_1.27.1-1_amd64.deb_amd64.deb - Verify your installation by probing the Telegraf version
telegraf --version - Provide the previously retrieved telegraf.conf to the installation by replacing the default configuration file.
mv ./telegraf.conf /etc/telegraf/telegraf.conf - Finally you are ready to enable the service and start your metrics ingestion.
sudo systemctl enable telegraf
sudo systemctl restart telegraf
We have prepared a screencast showing how the complete setup with all the step looks when executed in a sequence.
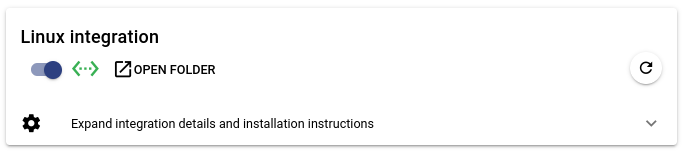
Now please head back to the Integrations section and enable your integration. Just toggle the switch and you should see in a few moments how the status indicator turns green indicating that the data is being ingested. Click OPEN FOLDER to start exploring.
Exploring Collected Metrics
Once you have successfully completed the setup part the data should appear in Opvizor/Cloud dashboards within a couple of minutes. Let's see what is there.
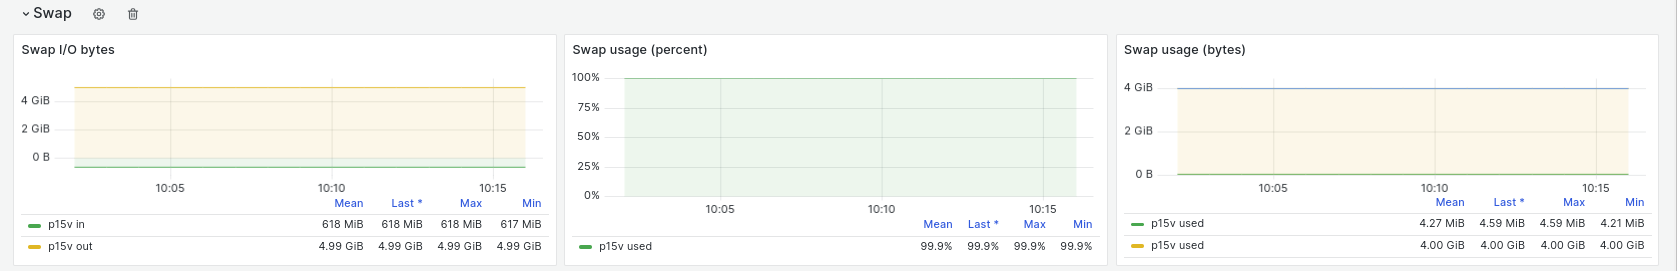
Panels within the Quick overview section can already reveal some surprises. Here for example Swap usage immediately pops out as a red flag.
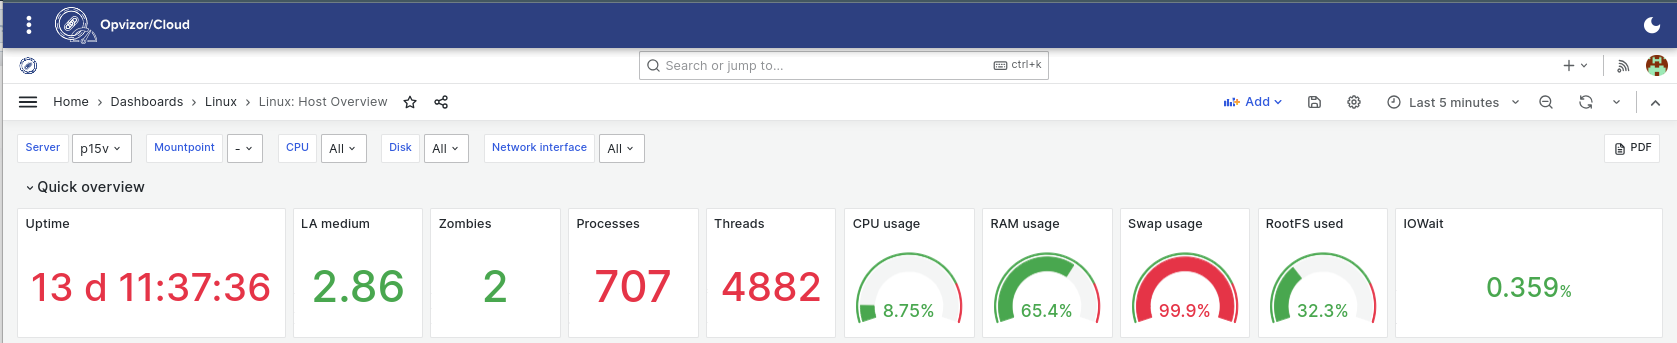
While the reasons behind it can be various this time it was a simple misconfiguration installing the Linux system with default settings of swap space just too small for the configured amount of operating memory.
Resource-Focused Sections
Further on resource specific sections are available to give you insights on your Compute, Memory, Network and Storage focus areas.
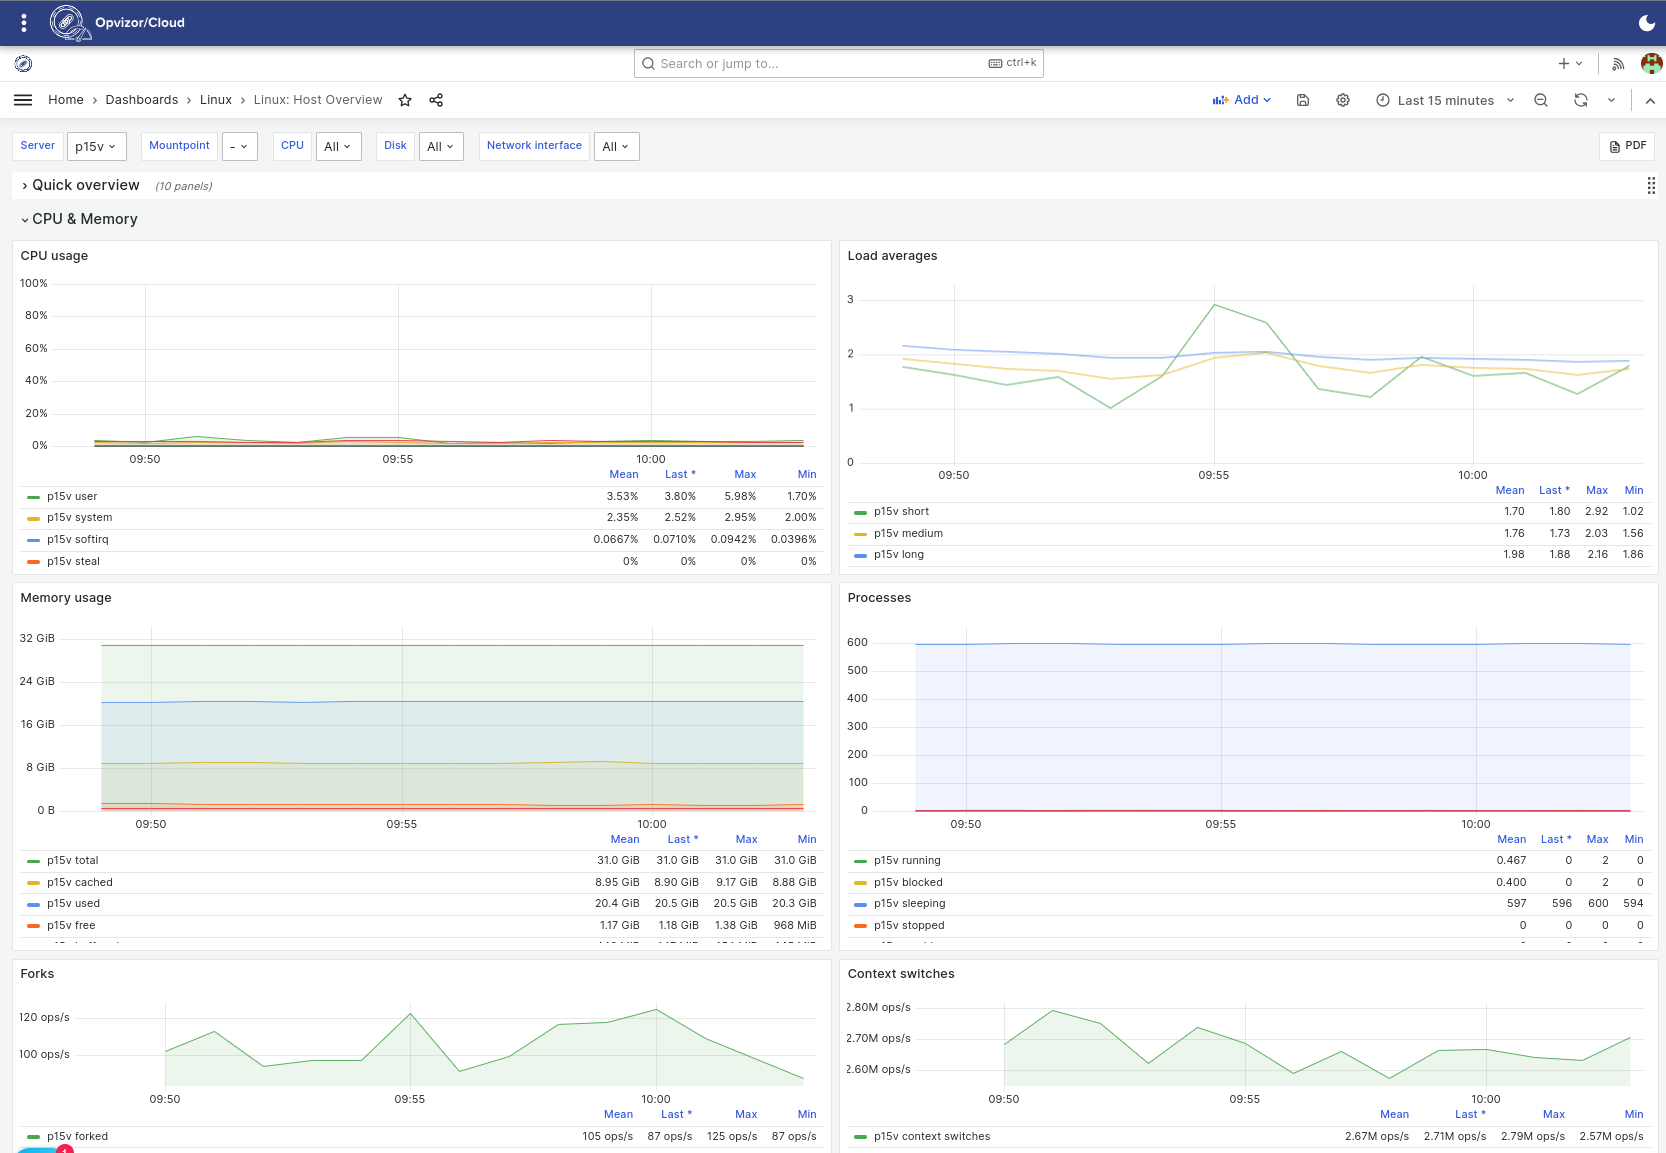
Compute and Memory
Starting with Load averages to Forks and Context switches expressed in well formed understandable dashboards.
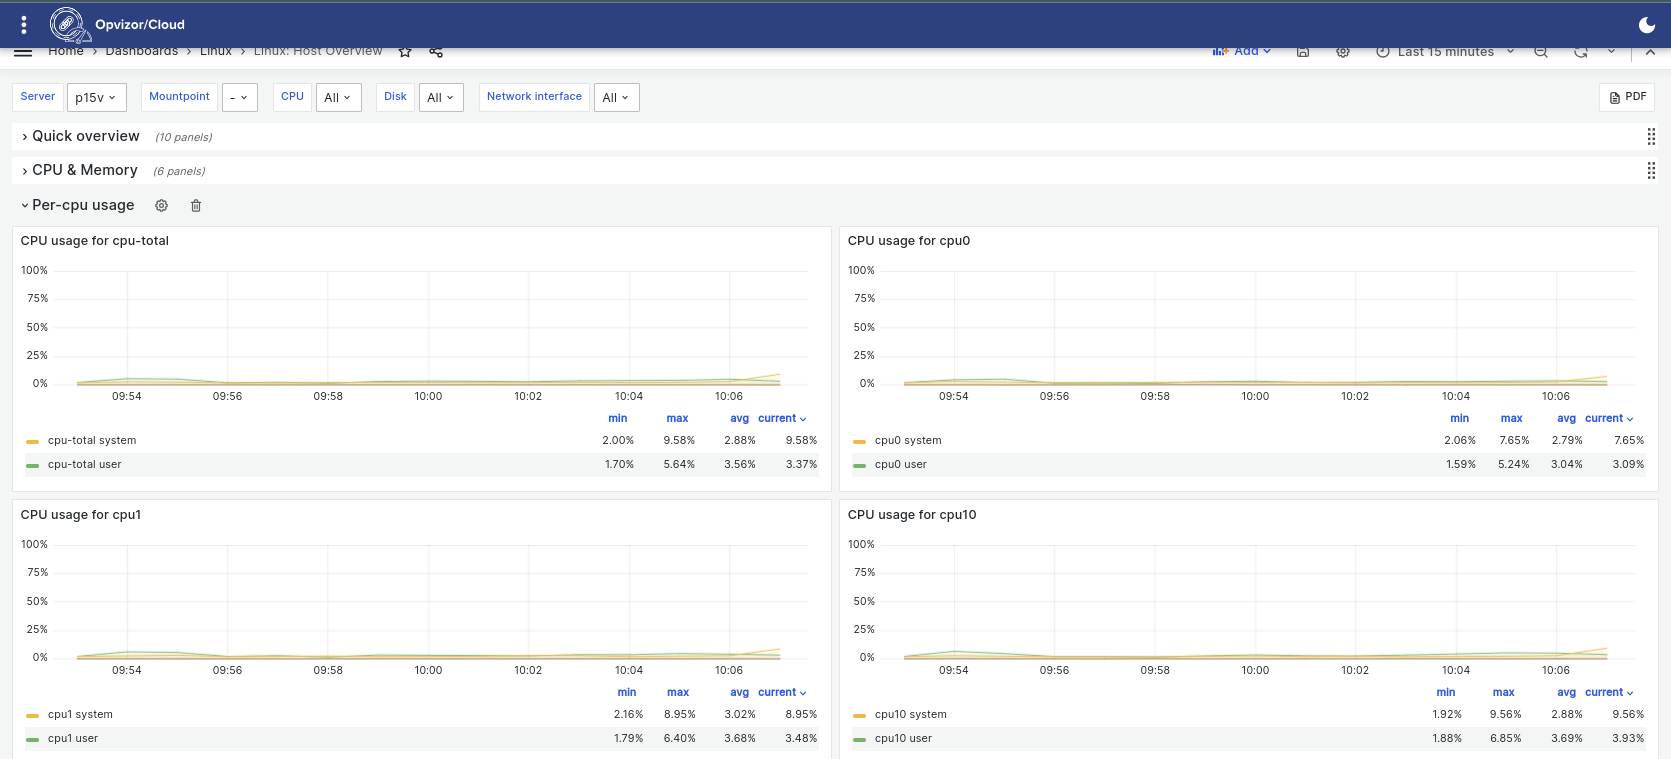
The Per-cpu section will show heavily used CPU cores or idling ones indicating potentially even or uneven workload resource association.
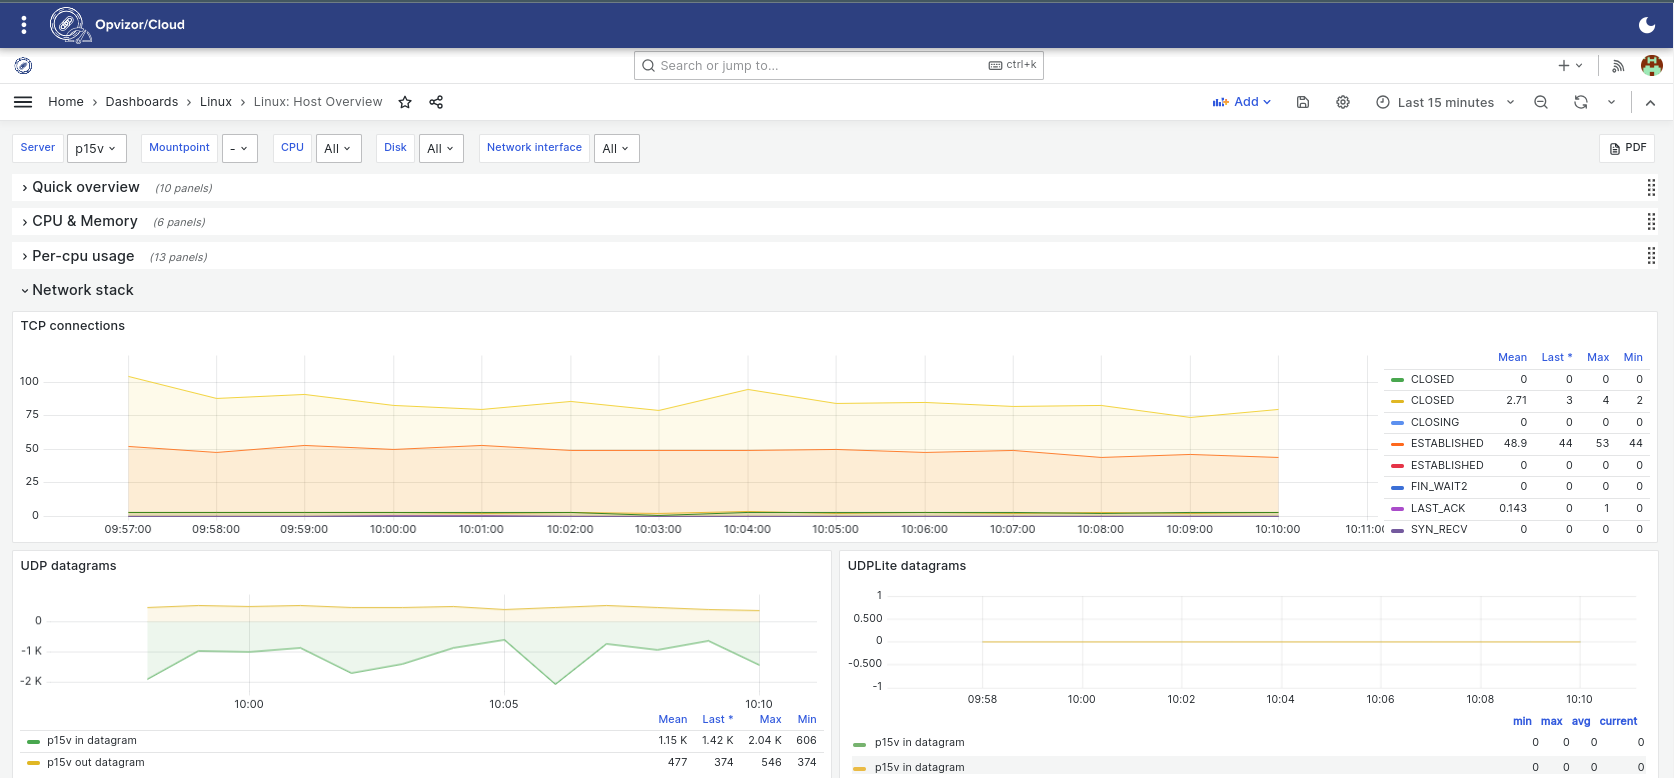
Network Stack
Have you ever found yourself debugging a service which constantly crashes in a couple of days for no apparently visible reason? Constantly growing count of badly managed network connections could be one of the reasons. Opvizor/Cloud can visualize this easily within the Network stack section.
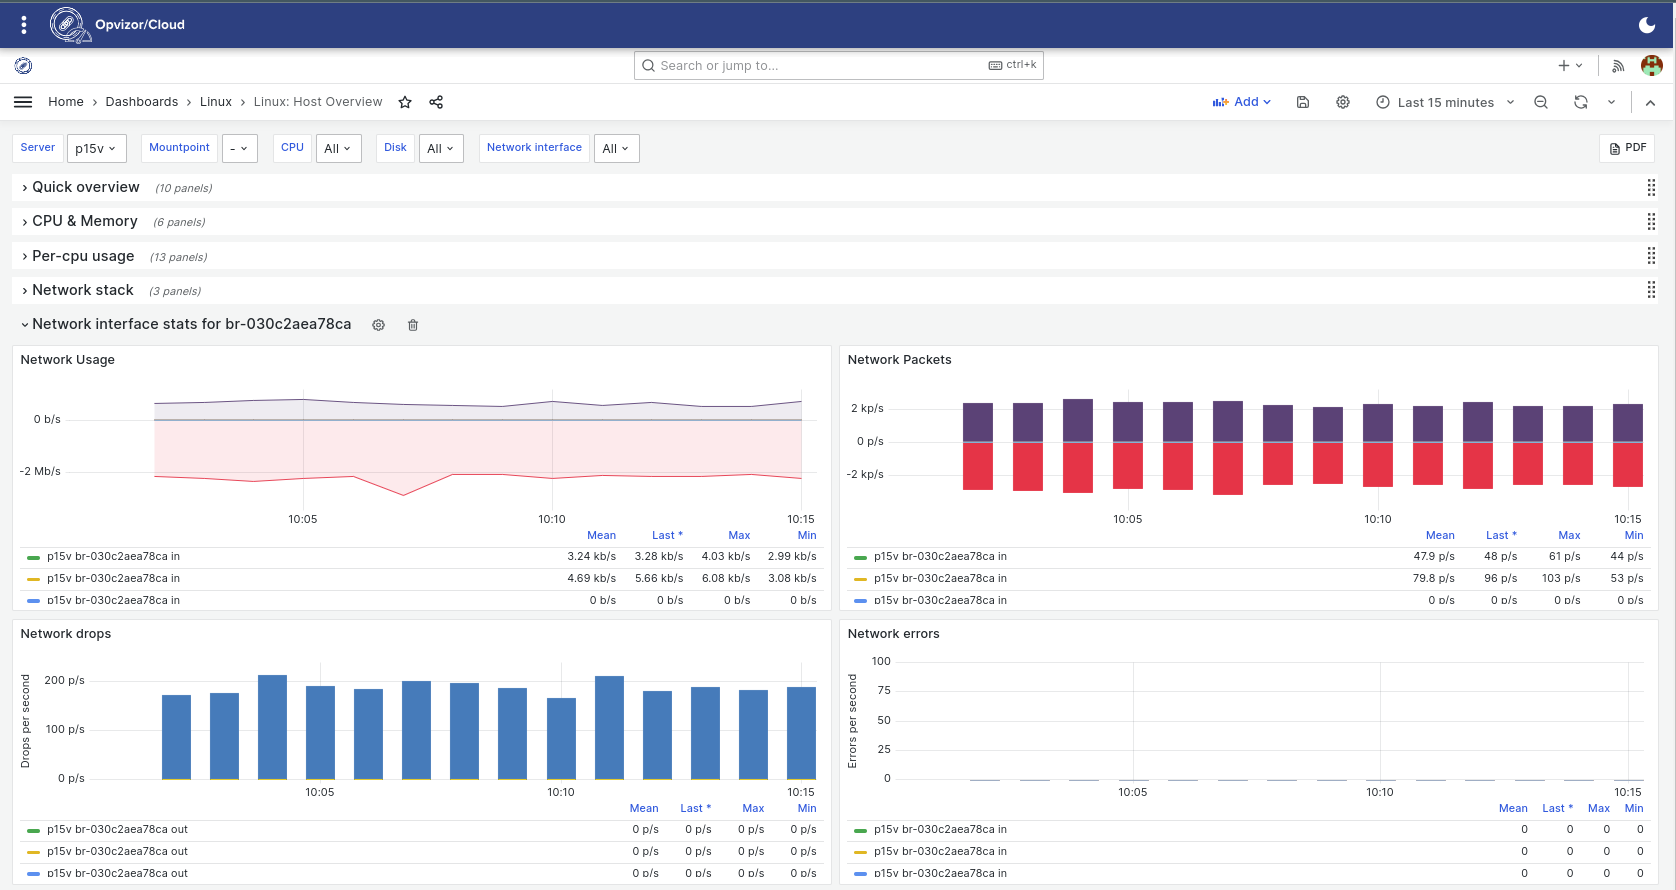
Usage and performance specific stats are available for each of your configured network interfaces.
Storage
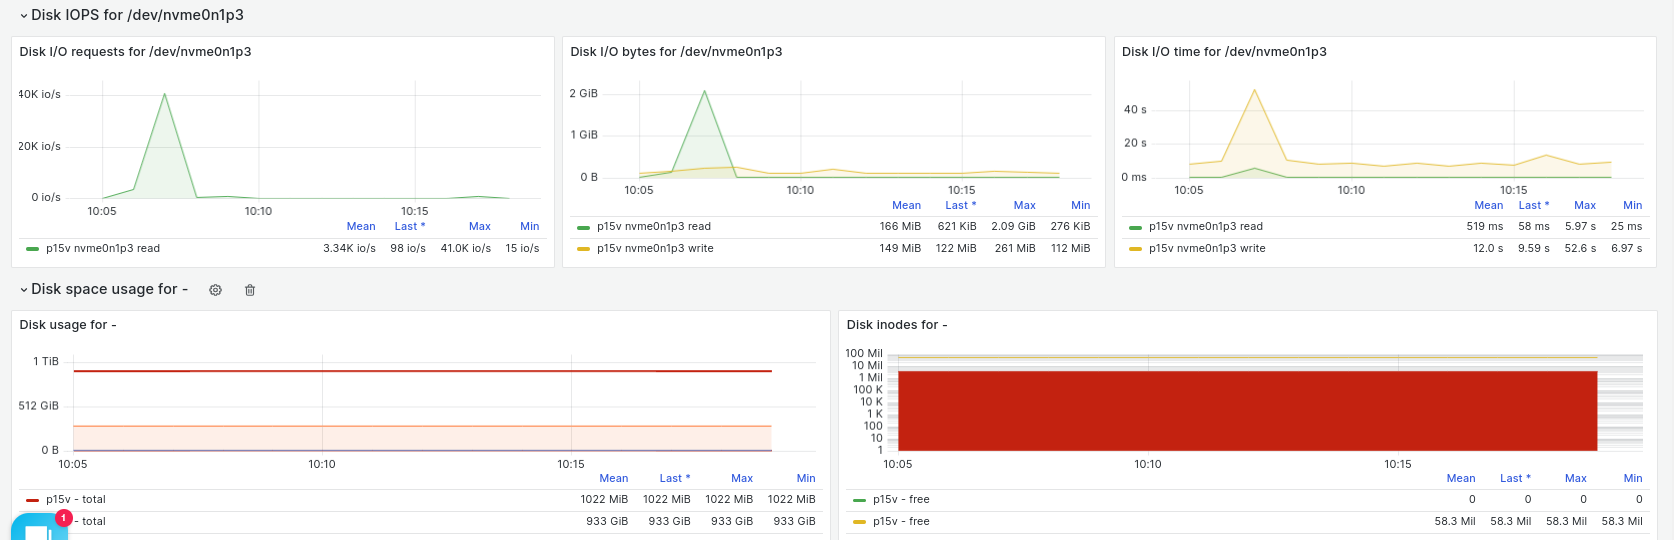
The monitoring of storage is not just about free vs used space. Disk performance can be critical for scaled infrastructures. Be it a scaled database service across your cluster nodes or a distributed storage for your kubernetes cluster the performance will matter.
Therefore Opvizor/Cloud makes Disk IOPS metrics available for each and every partition showing request count, transfer rates and time I/O operations. Metrics for disk usage and available disk inodes of course are there as well.
Conclusions
With 30+ resource specific panels multiplied by a count of configured CPU cores, network interfaces and attached storage per host you get a plenty of metrics to look at in one centralized place - Opvizor/Cloud.
The provided metrics in Linux Integration can serve as a useful tool to up your infrastructure monitoring no matter what is the size of it or where it runs.
No more troubleshooting with just a terminal through endless loops of commands when everything is visualized and accessible not just for the current state but way back.
Opvizor/Cloud starts at $58/month per ESXi host with volume discounts available.
To learn more about Opvizor/Cloud, visit https://opvizor.com/cloud or directly sign up at https://cloud.opvizor.com.