PostgreSQL Database Performance Monitoring and Analysis
Check out the PostgreSQL database integration in Opvizor. This monitoring solution designed to help you ensure the ongoing health and performance of your PostgreSQL deployment.
Next to databases like Microsoft SQL server and Oracle Opvizor can also monitor and alert on PostgreSQL.
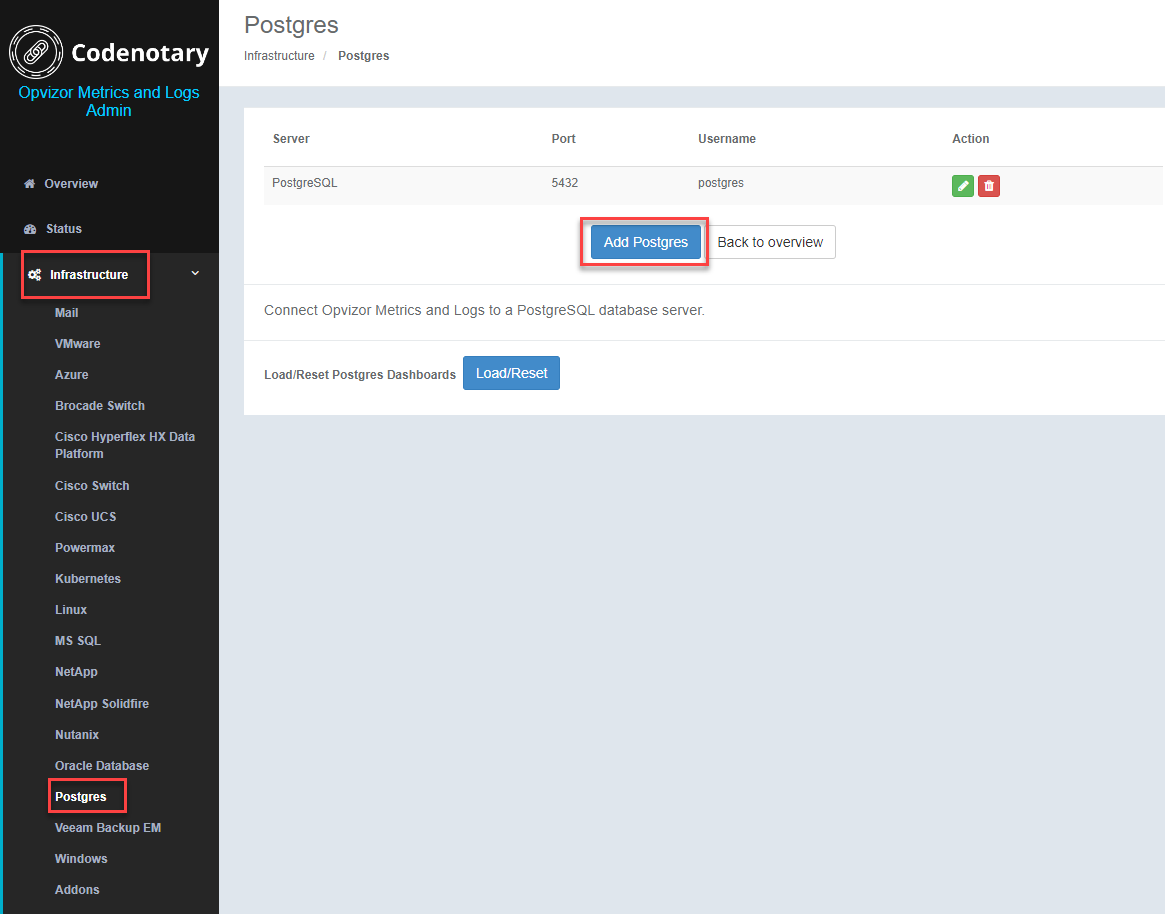
Given you already have a license, you can simply add your PostgreSQL instance with a few clicks.
Just have your PostgreSQL server network DNS or IP address ready and a database user that can read-only access the database metrics.
Adding the database server including all databases to the data (metrics) collector is as simple as always.

Next thing you can see is a new dashboard and the data flowing into:

The header section allows you to select between the database servers and databases.

We don’t just collect the server settings, all kinds of metrics and counters, we also show sessions, the queries and their runtime.
Collector information:
- starting time
- cpu usage
- memory usage
Settings:
- Shared Buffers
- Effective Cache
- Maintenance Work Mem
- Work Mem
- Max WAL Size
- Random Page Cost
- Sequential Page Cost
- Max Worker Processes
- Max Parallel Workers
General Counters:
- Version
- Max Connections
- fetched tuples
- inserted tuples
- update tuples
- deleted tuples

Database Stats:
- Used connections
- Transactions /sec
- Cache Hit Rate
- Tuple Insert /sec
- Tuples Fetch /sec
- Tuples Returned /sec
- Tuples Delete /sec
- Temp File (Bytes)
- Buffers (bgwriter)
- Lock Tables
- Conflicts
- Deadlocks
- Idle sessions
- Active sessions
- Checkpoint stats
Please contact us if you want to integrate your PostgreSQL database server as well. It's a great addition to our already existing VMware vSphere support, Linux, Docker, Kubernetes and many more.