Our Log Compliance extension has been adopted at lightning speed by our customers and it’s being used to full-text-search in ESXi and vCSA events, tasks and of course syslog data or as charts within our dashboards (including alerting).
Log Analyzer extension
Existing customers can simply contact us through the typical channels like chat or email.
If you want to try the Log Analyzer extension for the first time, simply download the current release on this website.
Components
The Log Compliance extension consists of multiple components that are seemlessly integrated.
- vSphere API collector (Tasks, Events)
- Syslog receiver (ESXi, vCSA, general syslog)
- Loki (https://github.com/grafana/loki)
- immudb (https://www.immudb.io)
That combination allows an unique set of functionalities:
- full-text search within any data type (Tasks, Events, Logs)
- vSphere navigation as usual (vCSA, Cluster, Host,…)
- support for non-vSphere systems or Guest OS (Windows, Linux, applications)
- integration of common queries within existing or log-focussed dashboards
- Mix log entry search with event search (i. e. storage vmotion event and related vmkernel log error)
Compliance
Last but not least – you can’t rely on log files, if they are not stored in a secure and tamperproof way. Therefore, we’re using immudb to immutably store raw syslog data and the cryptographic proof of origin.
When it comes to compliance (PCI and others) you need to make sure:
- Ensuring security of log data so that it cannot be tampered, changed or deleted
- Notifying system administrator personnel about any change or suspicious activity on crucial, confidential files
Configuration
After deploying the appliance for the first time or adding the license key that supports log compliance, all vSphere related tasks and events are captured automatically.
To receive the log files of your ESXi hosts and vCSA as well, you can use our appliance administration to setup syslog forwarding:
![]()
Configure VMware ESXi to forward syslog data
Note: we respect existing syslog entries and only append our configuration.
If you want to configure the Syslog forwarding manually, please check out the following VMware KB article:
VMware ESXi: https://docs.vmware.com/en/VMware-vSphere/6.7/com.vmware.esxi.upgrade.doc/GUID-9F67DB52-F469-451F-B6C8-DAE8D95976E7.html
VMware vCSA: https://docs.vmware.com/en/VMware-vSphere/6.7/com.vmware.vsphere.vcsa.doc/GUID-9633A961-A5C3-4658-B099-B81E0512DC21.html
Full Text Search
After some minutes you’re already able to search through the log entries. Simply click the log analyzer icon to enter the full-text-search:
When starting Log Analyzer for the first time you’ll see an empty search bar and a cheat sheet in the main window:
- Navigation: select the vCSA, ESXi or cluster to run the query against. The better you preselect, the less overhead logs will be shown
- Log Labels: you can further filter the log result using labels (i. e. severity, VM, …)
- The log search bar and the cheat sheet below. You can also find more information about the search in our guidelines:
https://github.com/opvizor/log-guide/blob/master/README.md - Timerange selection: you can either go for an absolute or relative timerange to filter the search result
- Run the query immediately or set a refresh frequency to automatically run the query continuously
- Change the entry limit. 1000 entries is the default that is visible in the main screen, but you can go up to several thousand if you like
Example queries
Some real life examples, to query certain log data:
# Return only warn log entries for the selected ESXi
{ESXi="esxname",severity="warn"}

# Match a certain string in the log file of the selected ESXi
{ESXi="esxname"} |= "exact match for content"

# Query only ESXi Syslog data
{ESXi="esxname", DataType="ESXi_Syslog"}

# Query SCSI entries (exclude SNMP)
{ESXi=~".+"} |~ "SCSI|NMP|ScsiDeviceIO|scsiCorrelator|vmk-iscsi|iscsi|iscsiCorrelator" != "SNMP"

# Query SCSI sence codes
{ESXi=~".+"}|="Valid sense data"
Check compliance
We use immudb to store all log data that has been received in a tamperproof way. Our goal is to make the auditing part as easy as possible and being compliant with all important European and US regulations.
When you want to check the integrity and immutability of the log entry, you can simply click the verification button:
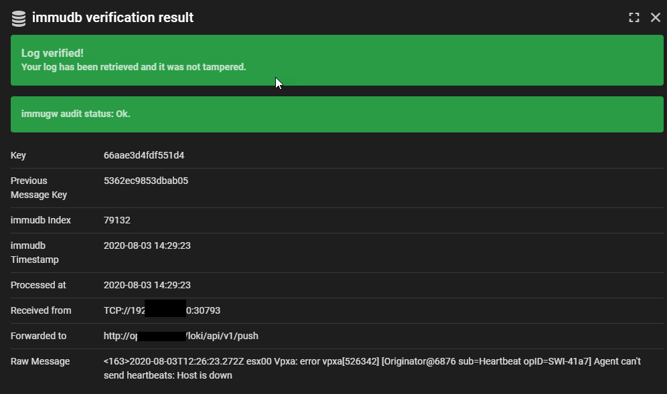
The shown result contains all log entry details and the verification of the whole immudb database as well as the individual entry.
That way the Opvizor appliance is not only storing syslog data using simple checksum chain technology – it’s built on top of the most innovative immutability data structure (immudb.io). That technology uses an append-only datastructure and a merkle-tree to guarantee the integrity with a cryptographic proof.
The additional index allows to detect deleted log entries as well.
Log and event Dashboards
You can also find 4 different dashboards that allow to detect and alert on common "problematic" log entries.
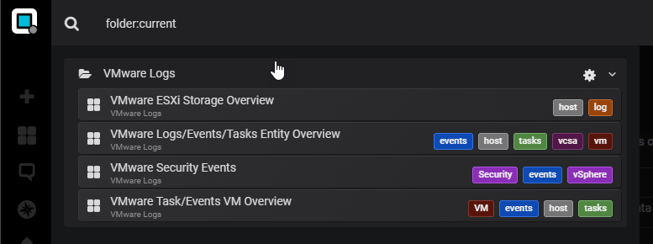
Lets look at the ESXi Storage Overview as an example:
That way you don’t need to remember the search query at all and simply use the predefined charts (search) or add new charts with your own queries.