It is always important that our customers cannot just monitor and analyze the VMware vSphere performance, but also check the applications and the underlying hardware.
The integration of VMware Horizon Performance monitoring and alerting is also of high importance. Especially the run for home office-based access to business and company desktops drove virtual desktops (VDI).
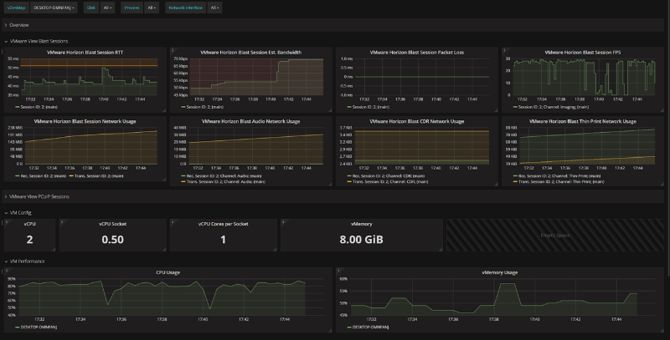
Monitoring the virtual desktop performance from inside the guest and not just the outside view using VMware vSphere data and also the NVIDIA GPUs is key to run a successful VDI offering.
The combination of across-the-stack metrics offers a single view that provides visibility from the end user VDI experience to the operating system, storage, and network. Issues at any part of the stack can have negative impacts for the user desktop experience.
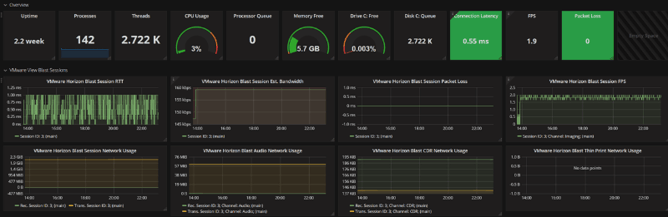
All critical metrics are tracked for PCoIP and VMware Blast, gathering data for logon duration, frames per second, data transfer and application, and OS, and ESXi performance.
Our easy-to-deploy and lightweight Guest agent runs within your Microsoft Windows virtual desktops as a Windows service and gathers all required PCoIP or VMware Blast metrics, depending on the protocol you´re using and the VMware View dashboard that makes sense of the received data in a simple and efficient way.
The dashboard merges information of the Guest OS, VMware VMkernel information, and PCoIP or Blast metrics.
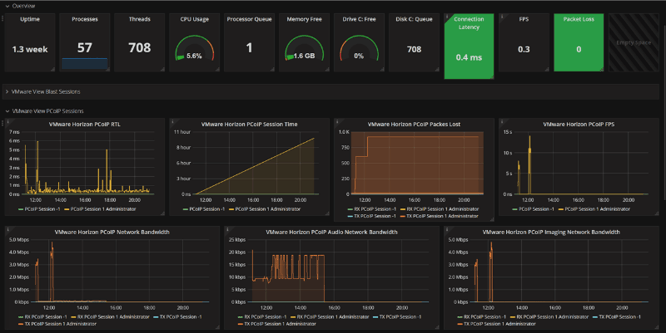
Especially critical metrics like Frames per Second, RTL, or Packet loss are directly visible. Furthermore, you can check if network bandwidth is taken using USB devices.
Combined with VMware Performance data directly from the VMkernel it makes a complete picture!
These are the metrics we´re collecting:
PCoIP Session Metrics
- Session Duration Seconds
- Bytes Received
- Bytes Sent
- Packets Received
- Packets Sent
- RX Packets Lost
- TX Packets Lost
PCoIP Session Network Statistics
- Round Trip Latency ms
- RX BW kbit/sec
- RX BW Peak kbit/sec
- RX Packet Loss %
- TX BW kbit/sec
- TX BW Active Limit kbit/sec
- TX BW Limit kbit/sec
- TX Packet Loss %
PCoIP Session Imaging Statistics
- Imaging Bytes Received
- Imaging Bytes Sent
- Imaging RX BW kbit/sec
- Imaging TX BW kbit/sec
- Imaging Encoded Frames/sec
- Imaging Active Minimum Quality
- Imaging Decoder Capability kbit/sec
- Imaging Megapixel/sec
VMware Blast HTML5 MMR counters
- Received Packets
- Transmitted Packets
- Received Bytes
- Transmitted Bytes
VMware Blast Imaging Counters
- Dirty frames per second
- Poll Rate
- FBC Rate
- Frames per second
- Received Packets
- Transmitted Packets
- Received Bytes
- Transmitted Bytes
VMware Blast Session Counters
- Received Packets
- Transmitted Packets
- Received Bytes
- Transmitted Bytes
- Jitter (Uplink)
- RTT
- Packet Loss (Uplink)
- Estimated Bandwidth (Uplink)