Opvizor for Kubernetes on VMware vSphere or Tanzu
You might have noticed that we, at Opvizor, consistently improve the container support of Performance Analyzer. No matter if you’re running docker container on Docker hosts or you’re using Kubernetes. As we already have one of the most detailed and complete VMware monitoring stack in the industry, especially the Kubernetes monitoring part comes in very handy for many customers. The simple reason – they run Kubernetes on vSphere, so the Kubernetes host is a virtual machine running on VMware vSphere.
Performance Analyzer takes the lead when it comes to full stack monitoring and performance analysis starting with the VMkernel (NUMA imbalance, Kernel storage queue and much more), getting into the virtual machine performance metrics (memory ballooning, cpu ready aso.), into the Guest (Kubernetes node exporter – cpu, memory, numa, disk utilization) and into the Kubernetes Pod (Container context switches, packet loss …).
If you’re running Kubernetes on vSphere in a production environment or a serious manner, you should get Performance Analyzer imported and go for the complete picture instead of the puzzle.
Let’s get into some details
After connecting Performance Analyzer to your VMware vCenter servers as well as your Kubernetes environment, you can find the performance metrics within a short amount of time in nicely structured dashboards.
The matching between the Kubernetes Nodes and the virtual machines these are running on happens automatically. A typical dashboard to start with is Starter: VMware Virtual Machines K8s that shows all vital metrics in one spot. Please contact us, if you want to test the Kubernetes on vSphere integration.
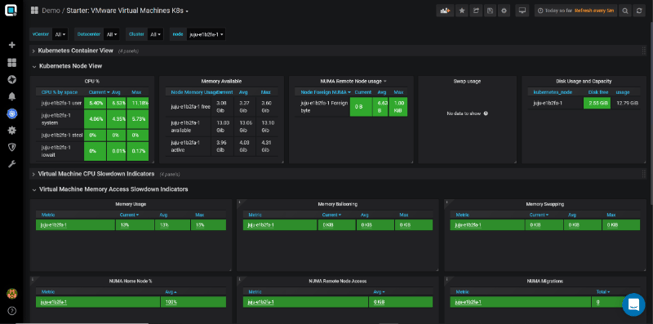
Some highlights next to the common performance metrics are the NUMA home node and NUMA remote node utilization charts. NUMA metric collection requires a simple change either in your existing Node exporter or you deploy the Opvizor Node exporter. That dashboard is a good starting point as it shows the full stack.
The Node exporter Full dashboard provides a detailed visualization of Kubernetes nodes, no matter if they are running on top of VMware vSphere or native on a hardware. All important resource metrics can be checked and alerted on – CPU, Memory, Disk, Network.
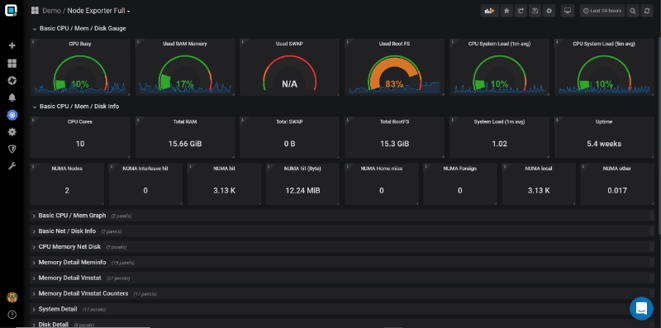
Also detailed NUMA utilization metrics or filesystem information are available.
Coming back to the Starter dashboard as it also shows the Container information including the top consumer or troublemaker. The data is collected over time, so you can easily change between the last couple of minutes or what happened over the last weeks or even months. Please be aware that more data means more IOps, when being visualized, therefore, its important to doublecheck the out-of-the-box configuration with our support if you run environments with several hundreds or thousands of Pods.
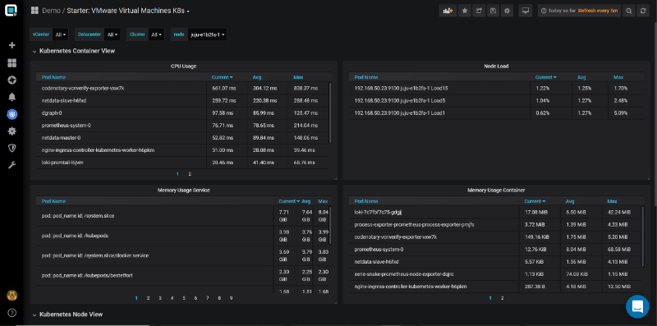
Furthermore, the dashboards shows the current load, the average load over the selected timerange and the peaks.
Of course, we provide several Pod details dashboards as well. You can check all KPIs of the container and even filter by any available Kubernetes tag (app, service and much more) and not just the pod name.
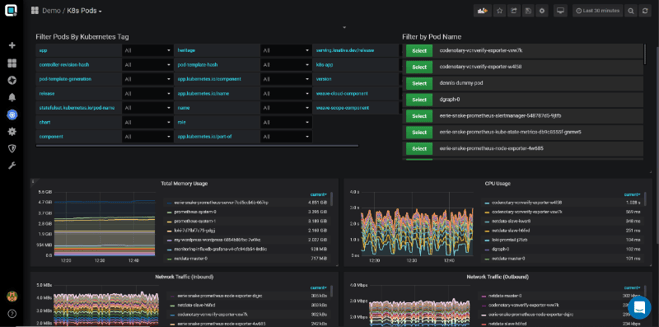
Many available monitoring tools either stop or start here and don’t provide VMware vSphere details or detailed container details, like Pod process details. We provide a helm chart for our customers that deploys a daemonset to run a pod process exporter on the Kubernetes nodes.
That way we can not just collect the outer performance metrics, but also the inner metrics. Number of processes, memory utilization, Context switches or written bytes are just some of the information you can collect for all or chosen processes of your container (process selection can be configured).
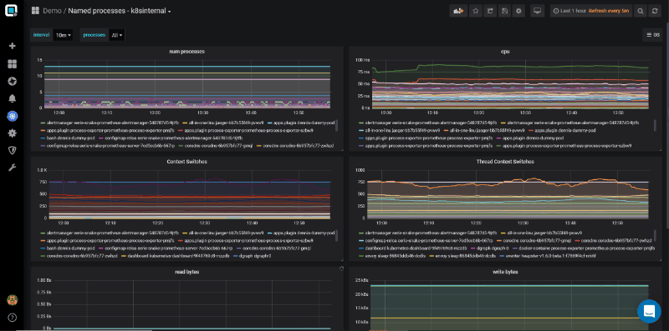
Now you got the full picture how much information you can collect, visualize and use for alerts when running Kubernetes and VMware vSphere. What we missed in that post is the ability to do live troubleshooting as well as relating container log files with container performance data. We dig into that in follow up blog posts.