When deploying a Python Gunicorn application, you typically want to monitor its performance and health. One effective way to achieve this is through instrumentation using the StatsD protocol. Gunicorn supports this through its gunicorn.instrument.statsd module, allowing you to gather key metrics related to request handling, worker performance, and logging events.
This post will walk through setting up StatsD instrumentation in Gunicorn, using Telegraf as a StatsD server, and forwarding these metrics to Opvizor/Cloud for visualization on a dashboard.

Instrumenting Gunicorn with StatsD
Gunicorn provides built-in support for instrumentation using the StatsD protocol. The StatsD protocol is designed for simple and efficient real-time monitoring and is well-suited for tracking application performance metrics.
To enable StatsD in Gunicorn, specify the StatsD server’s address using the --statsd-host option:
$ gunicorn --statsd-host=localhost:8125 --statsd-prefix=service.app ...
In this command:
--statsd-host=localhost:8125points Gunicorn to the StatsD server running on the local machine at port 8125.--statsd-prefix=service.appadds a prefix to all metric names, which is useful for organizing metrics by service or application.
Once enabled, Gunicorn emits several key metrics:
gunicorn.requests: Tracks the request rate per second.gunicorn.request.duration: Provides a histogram of request durations in milliseconds.gunicorn.workers: Indicates the number of worker processes managed by the Gunicorn arbiter.gunicorn.log.critical,gunicorn.log.error,gunicorn.log.warning,gunicorn.log.exception: These metrics track the rate of critical, error, warning, and exceptional log messages, respectively.
These metrics give a clear view of the performance and operational status of your Gunicorn application.
Running Telegraf as a StatsD Server
To consume the metrics generated by Gunicorn, we use Telegraf, an agent for collecting, processing, and reporting metrics. Specifically, Telegraf's StatsD input plugin allows it to act as a StatsD server, receiving metrics over UDP.
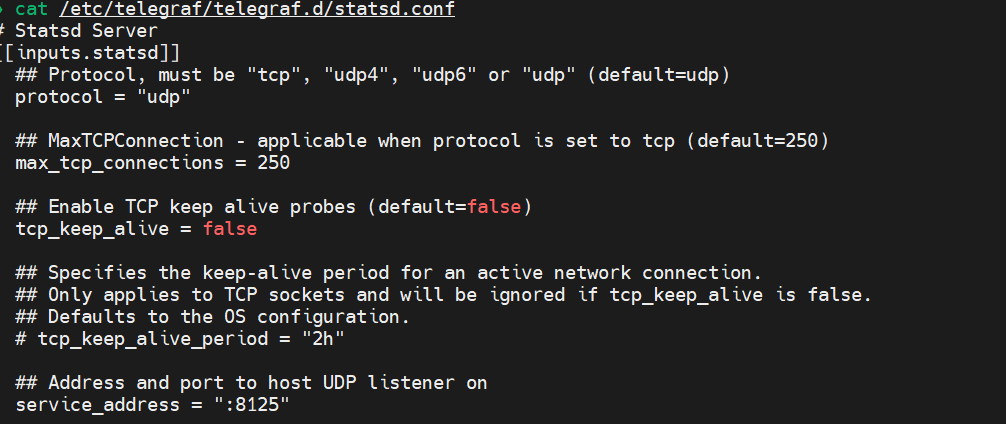
Below is a sample Telegraf configuration for setting up a StatsD server:
# Statsd Server
[[inputs.statsd]]
  protocol = "udp"
  service_address = ":8125"

  delete_gauges = true
  delete_counters = true
  delete_sets = true
  delete_timings = true

  percentiles = [50.0, 90.0, 99.0, 99.9, 99.95, 100.0]
  metric_separator = "_"
Explanation:
protocol = "udp": Configures the StatsD server to use UDP, which is efficient for high-throughput, low-latency scenarios like metrics collection.service_address = ":8125": Binds the server to port 8125, matching the port configured in Gunicorn.delete_*: These options reset various metric types (gauges, counters, sets, timings) at each interval to avoid stale data.percentiles: Defines the percentiles to be calculated for timing and histogram statistics. This is crucial for understanding the distribution of request durations.
With this configuration, Telegraf will receive and process metrics from Gunicorn, preparing them for forwarding to your monitoring system.
Forwarding Metrics to Opvizor/Cloud
Opvizor/Cloud is a powerful platform for visualizing and analyzing metrics. To forward the metrics collected by Telegraf to Opvizor/Cloud, you typically configure an output plugin in Telegraf to send the metrics to the Opvizor/Cloud endpoint.
Here’s a minimal example of what the configuration might look like:
# Output to Opvizor/Cloud
[[outputs.http]]
  url = "https://sink.opvizor.com"
  data_format = "graphite"
  graphite_tag_support = true
  prefix = "opvagent"
  [outputs.http.headers]
    X-API-KEY = "Opvizor-API-Key"
Explanation:
url: The endpoint for Opvizor/Cloud where metrics are sent.api_key: Your authentication token for accessing Opvizor/Cloud.
Once set up, Telegraf will continuously forward the metrics to Opvizor/Cloud, where you can visualize them on a dashboard. Opvizor/Cloud offers various visualization options, such as time-series graphs, histograms, and alerting features, which are essential for monitoring the health and performance of your Gunicorn application.
Opvizor/Cloud:
The received data can be checked using the Opvizor/Cloud Explore functionality by selecting the sending host and the metric name. All metrics have gunicorn in the name.

The data can be visualized in a new or existing dashboard, i. e. showing requests by day:summarize(seriesByTag('host=prod', 'name=gunicorn_requests'), '1d', 'sum', true)

Conclusion
By integrating Gunicorn's StatsD instrumentation with Telegraf and forwarding the metrics to Opvizor/Cloud, you establish a robust monitoring solution for your Python application. This setup enables real-time visibility into your application's performance, helping you to quickly identify and respond to any issues that arise.