We received a request for a Performance Analyzer heatmap dashboard that allows drilldown showing critical virtual machine highlights. Thanks to our highly flexible platform that is build on Grafana, we could prepare the dashboard within an hour and the customer had it up and running the next minute.
That´s not it – when we prepare a dashboard for one customer, every customer of us can use the dashboard as well. Therefore, you can download the heatmap dashboard in our Change Log / Patch section of our online manual.
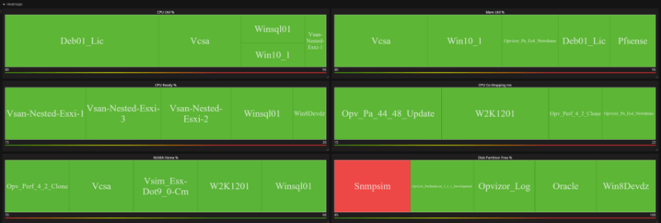
Just download Performance Analyzer and give it a try and check http://manual.opvizor.com (Change Log/ Patch) to get the new Virtual Machine Performance Heatmap dashboard.
We always listen to customer feedback – therefore, if you have any ideas or comments, please let us know. Maybe your dashboard idea is next.