Many customers and VMware experts are using VMware vSAN as a storage system. When it comes to performance tuning, storage histogram views for I/O are essential.
Opvizor delivers many dashboards out of the box, which makes performance monitoring and tuning very efficient.
Everybody working in the storage field knows, that the efficiency of caching and eventually the whole disk/raid architecture depends on matching the real IO pattern. Unfortunately, most people don´t know the IO request that is handled by the storage system at a certain point in time.
Opvizor changes that.
Our storage I/O visibility integration for VMware vSAN, allows the IT admin to check for block sizes and read/write ratio over a chosen time range.
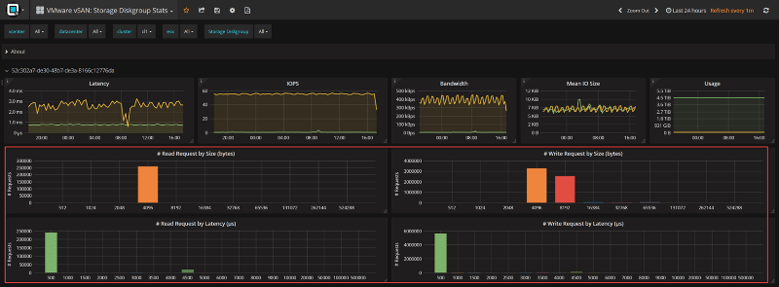
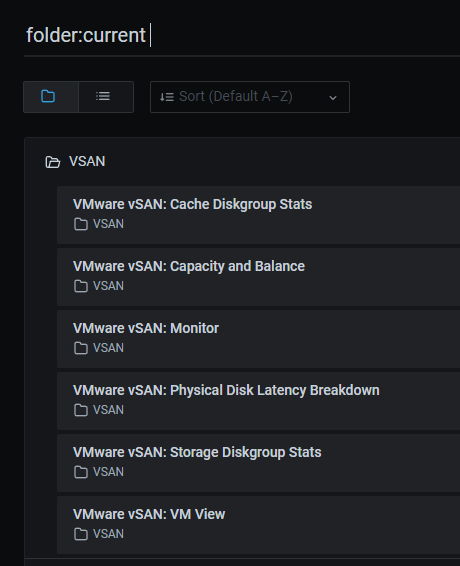
Within the Dashboard VMware vSAN: Storage Diskgroup Stats and VMware vSAN: Cache Diskgroup Stats you can find 4 new histogram widgets, showing:
- Read requests by block size
- Write requests by block size
- Read request latency
- Write request latency

Btw. we´re currently also working on a per VM and per VMDK integration, so you can create a real storage profile of your running systems.
To get the new integration up and running, just start a trial or reach out to our sales or support team to get a license.
If you don´t use Opvizor yet, just start a free trial now and get the vSAN extension going.