VMware vSphere: VM Memory Issues Can Hit Your VM Performance
Virtualization is being widely used in modern data centers and cloud
environments due to flexibility, reliability, agility, and ease of
management. Its hypervisor abstracts the underlying hardware and
transparently allocates to the Virtual Machines (VMs) independent of
their Operating Systems (OS). With help of a hypervisor, multiple
virtual instances or VMs can be created and run on a single hardware.
VMware vSphere offers the world’s best server virtualization
capabilities that offer running multiple virtual instances on a single
hardware or physical machine. Failure of hardware or poor performance of
a physical machine affects the applications running in VMs on that
machine, and with virtualization technology, multiple VMs running on
that particular physical host can slow down the host and affect
applications running on all of the VMs. Hence, performance monitoring of
a virtual infrastructure is also very important to smoothly run and
manage it.
The performance of any app that is running on a VM in a VMware vSphere
infrastructure depends on many factors including:
-
Server virtualization abstracts the physical resources such as CPU,
memory, disk, and network from the underlying hardware or hosts, and
shares them between hosted VMs on that hardware, and if a few VMs
consume a heavy amount of resources, then other VMs can’t have
access to those physical resources when they need it; this affects
the performance of the application on other VMs. -
Administrators can limit the available resources on installed VMs,
and not properly configured limits can congest the performance of
applications on those VMs. - VMware admins sometimes over-commit physical resources to VMs on the
hosts, and not all VMs on these hosts may have the requirements of
physical resources at the same time. Over-commitment of the physical
resources ensures better utilization of resources, but it needs to
monitor the actual utilization of resources on the hosts to identify
where an ESXi host is resource-starved. If you haven’t identified
the actual utilization of resources, the performance of VMs may be
affected.
To improve the performance of a VM, a virtualization engineer should
track the usage of resources by a VM over time and right-size the
resources of VMs accordingly.
VMware vSphere contains various VM memory access resource components
including memory ballooning and memory swapping, and in this article,
we’ll discuss these memory access resources:
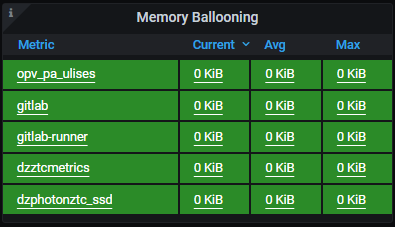
Memory Ballooning
Memory ballooning in VMware vSphere environment is a memory reclamation
mechanism used by the ESXi (Type-1 or bare metal) to allow the ESXi host
to reclaim unused memory from VMs, where VMs that are experiencing a
shortage in memory can use the reclaimed memory to run an application.
Normally, the hypervisor is responsible for assigning a portion of the
memory of the ESXi host to each installed VM on it, and the guest OS
that runs inside a VM is unaware of available memory to the ESXi host.
Memory ballooning makes the installed guest OS in a VM aware of the
shortage of the ESXi host’s memory.
Whenever an ESXi host is in a situation of memory-contention and the
VMware Tools with the ballooning driver are installed in the guest OS of
the VM, they determine whether unused memory of any VM can be reclaimed.
Then, the drivers inflate (balloon) the memory on an under-utilizing VM
and prompts the ESXi host to reclaim the unused memory from that VM into
the overall resource pool. The ESXi host then makes this additional
physical memory available to other VMs on the ESXi host.
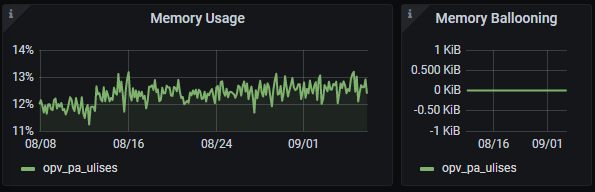
How Does Memory Ballooning Work?
Memory ballooning in VMware vSphere allows efficient utilization of
physical memory of the ESXi host, however that comes at the cost of VM
performance due to excessive memory ballooning on the ESXi host that
enables the guest OS on the VM to read from the disk, and high disk I/O
degrades the performance of a VM.
To prevent this excessive memory ballooning, VMware administrators
should continuously track and monitor how much memory the ESXi host is
reclaiming from the installed VMs and ensure not to grow too close to
the set ballooning target. In the guest OS, monitoring of VMs offers
little help in this regard, but monitoring the ballooning at host or
hypervisor level proactively detects and controls memory excesses.
Metrics and Logs offers to monitor the memory usage,
memory ballooning, and memory swapping of a VMs in VMware vSphere
environment.
Sign up for Metrics and Logs to check your VM memory
situation for free!
To find the above-mentioned important metrics, go to VMware Starter ->
VMware Virtual Machine Dashboard -> Virtual Machine Memory Access
Slowdown indicators.
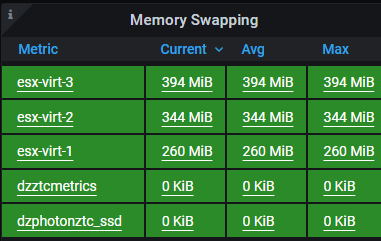
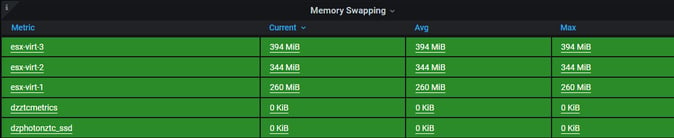
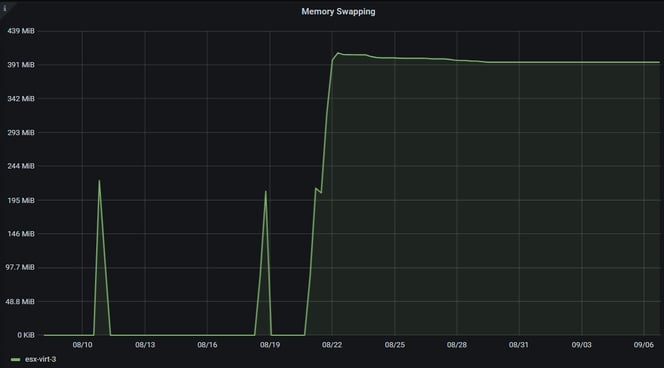
Memory Swapping
Memory swapping occurs when the memory state of the physical host or
ESXi host in VMware vSphere is under stress, or when reclamation
mechanisms such as ballooning, compression, and page sharing are unable
to keep pace with the rate of VMs memory allocation.
How Does Memory Swapping Work in Guest OS in vSphere?
Memory swapping occurs in VMware vSphere at two levels:
-
Memory Swapping at Guest OS Level: When a CPU accesses a virtual
memory at the guest OS level, it is swapped into physical memory
and therefore virtual memory pages become available in physical
memory and are served very quickly in the virtual environment.
Memory pages which are rarely used are swapped to storage, and
this creates a risk of high disk I/O resulting in slow overall
application performance. - Memory Swapping at Hypervisor-level: At hypervisor-level, memory
pages on the VMs are swapped out to swap space, and each VM is
linked to its own swap space. VMware vSphere manages the memory
swapping from swap space when the guest OS accesses a memory page
from the swap space. Swapping is always the last resort for a
Hypervisor as data is moved from ultra-fast RAM to disk (SSD won’t
help much). Ballooning is always preferred to clear memory
congestion. Therefore, active memory swapping at the Hypervisor
level can also be caused by missing VMware tools in the Guest OS
(that perform ballooning)..
Monitoring solutions that are available in the market and focus on VM
performance can track the poor performance of a VM but aren’t able to
diagnose its root cause. An ideal monitoring solution for a VMware-based
virtual environment will track memory swapping at the guest OS level and
the hypervisor-level, while auto-correlating the metrics, and accurately
pinpointing what is affecting the performance of a VM.
Metrics and Logs is one of the best VMware vSphere
monitoring solutions that runs in minutes in your virtual environment
and immediately starts monitoring the VM memory and other important
metrics.
Conclusion
To improve VM performance in a virtual environment, VMware admins should
track the version and status of installed VMware Tools on each VM, and
the usage of CPUs and vCPUs can also be monitored so that both the
physical host and VMs are right sized with the right CPU resources.
Metrics and Logs is a software that runs within
minutes in your VMware-based virtual environment and immediately starts
monitoring the VM memory access slowdown indicators and tracks these
metrics over time.