It’s crucial to monitor Azure resources for availability, performance, and operation when you have key applications and business processes that rely on them. This article outlines the monitoring data created by Azure virtual machines (VMs), as well as how to analyze and alert on this data using the features of Opvizor.
We recently added Microsoft Azure performance monitoring for virtual instances, databases, and other resources.
You may now filter by tenancy, management group, or subscription to see all of your virtual machines (instances) and SQL instances operating on Microsoft Azure.
Metrics & Logs retains the data across months and years, allowing for both short-term and long-term performance monitoring (based on your configuration). As all data is stored on the appliance, you can expect very fast and over-the-top performance query possibilities and benefit from the over-the-top dashboards.
What is Microsoft Azure?
Microsoft Azure is a versatile cloud computing platform that supports over 200 products and services that are available through the internet and is widely used for development and testing. Its adaptability, as well as the ability to deploy applications in minutes, make it an invaluable tool for most businesses. Azure manages and maintains the hardware, infrastructure, and resources that may be used for free or on a pay-per-use, on-demand basis, similar to other public cloud platforms.
In the workplace, Microsoft Azure is a popular choice, with Microsoft claiming Azure is used by 95% of Fortune 500 enterprises.
Customers that subscribe to Azure get access to all of the services available through the Azure portal. These services allow subscribers to construct cloud-based resources like virtual machines and databases.
Monitoring Microsoft Azure Virtual Machines
Understanding and maintaining the health and performance of the apps operating on Microsoft Azure might be difficult because it is a complex cloud service. The usage of Azure monitoring tools is required for this. By collecting, evaluating, and acting on telemetry from your cloud and on-premises settings, the Opvizor software helps you keep your services up and operating. It gives you a complete insight into your apps and assists you in identifying and resolving issues that may be hurting their performance.
You may access and examine basic information about the virtual machines deployed in your Azure VM environment, from availability to performance history. Get a bird’s eye view of all your virtual machines in the Azure environment and keep tabs on their health and operating conditions.
Monitoring Azure VM Metrics with Opvizor
Virtual machines must be monitored to maintain track of their performance and health. Metrics and Logs provides an interactive interface for monitoring Azure Virtual Machine performance information.
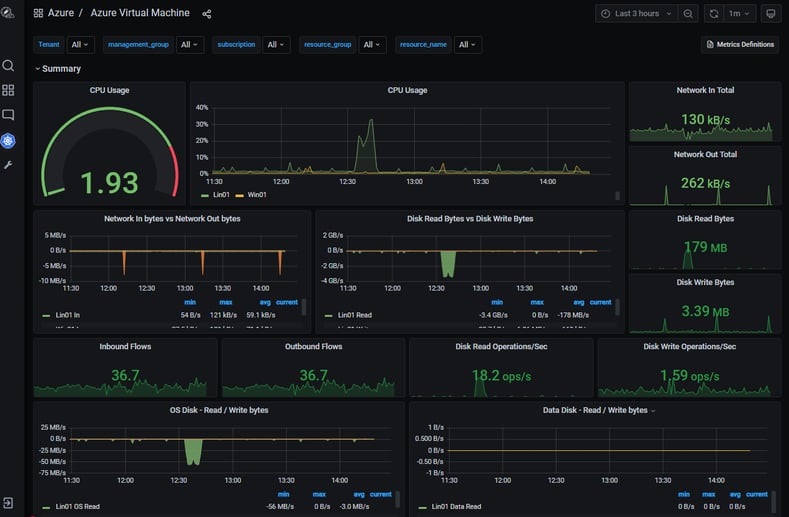
The following are the five main statistics:
- CPU Usage
- Disk Read Operations/Sec
- Disk Write Operations /Sec
- Network in
- Network out
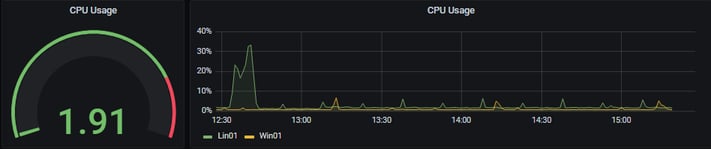
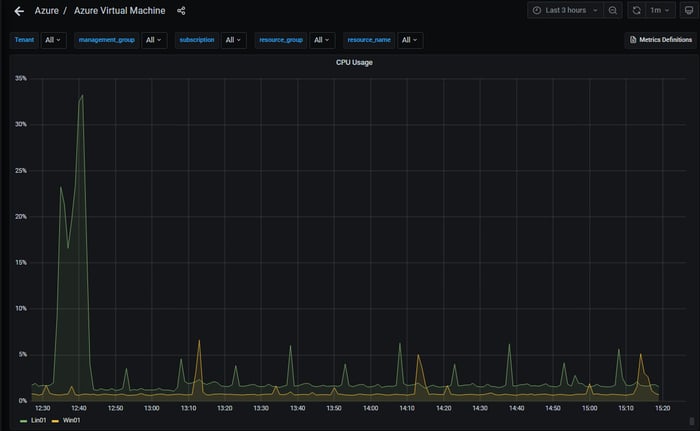
CPU Usage
When there is a performance issue in an application, the most typical metric to check is CPU %. It provides a percentage representation of the processor’s use. In the screenshot below, you can see that half-hour is selected, and the maximum usage is at 1.91.
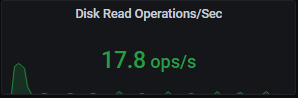
Disk Read Operations/Sec
Disk input/output procedures are another aspect that affects performance. The quantity of data read from a disc per second is measured in disc read operations/second. Performance concerns can be overcome by employing a faster disc if read operations are performed more often on the drive.
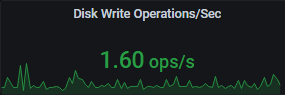
Disk Write Operations /Sec
Disk write operations/sec, on the other hand, quantifies the quantity of data written per second. If the program requires a high volume of data to be written to the disc, a larger disc might be used.
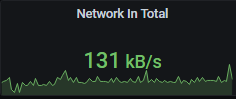
Network In
The ‘network in’ area may be used to keep track of network traffic. The received network-in statistics might be expressed in bytes or TCP segments.
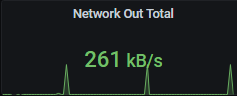
Network Out
TCP segments transmitted per second are discussed in network-out statics.
Wrapping Up
With the latest version of Opvizor, you can easily and confidently monitor the performance of your Microsoft Azure VMs. It has a dashboard with a lot of information that might be quite useful for monitoring your Azure setup.
It allows you to create Azure monitoring dashboards that allow you to collect and monitor Azure application, performance, and infrastructure information in one location. To get a hands-on experience just start a free trial.