We often require a system that effectively monitors and manages the inventory and configuration of a cloud-based virtual infrastructure, such as VMware. This system allows users to easily view and understand their current configurations, and track any changes made to them.
Additionally, it should be able to show how those changes may impact the performance of the infrastructure. In this article, you will learn about useful tools: Auditable Change Management for VMware infrastructure monitoring and management.
This task of infrastructure monitoring management is very complicated, as it requires a deep understanding of the underlying technology and the ability to analyze large amounts of data from various sources. It may involve the use of advanced configuration management (ACM) tools and techniques, as well as the collection and analysis of events and performance metrics from the virtual infrastructure.

Metrics and dimensions
To effectively monitor and manage the inventory and configuration of cloud-based virtual infrastructure, along with performance, several dimensions and metrics of data are required.
Dimensions of data can include:
- Virtual machine (VM) name, ID, and type
- Host server name and ID
- Resource pool or cluster name
- Datacenter and network location
- Operating system and version
- Application or service name
Metrics of data can include:
- CPU usage, utilization and ready time
- Memory usage, swap, and ballooning
- Disk I/O and usage
- Network usage and latency
- Power state and uptime
- VM snapshot and backup status
- Host server hardware utilization (such as CPU, memory, storage, and network)
Additionally, it may be important to have data on the changes made to the inventory and configurations, such as what changes were made, who made them, and when. One could track them with metrics like Configuration change history and Configuration drift.
It’s also important to have metrics on the performance of the infrastructure, such as:
- Latency and response time of applications and services
- Throughput and availability of network and storage resources
- Error rates and failure rates
- Resource contention and contention for shared resources
By collecting and analyzing this data, it will be possible to gain a comprehensive understanding of the state of the infrastructure and identify areas where configuration changes or performance improvements may be needed.
ACM as an infrastructure monitoring management system
We have already tackled the problem of reliable monitoring of virtual infrastructures by releasing Auditable Change Management. ACM is an infrastructure monitoring management system build upon immudb, an immutable database.
Auditable Change Management allows companies to cryptographically prove they never exceeded the limit of resources in their VMware infrastructure. ACM tracks changes on ESXi host or virtual machine. It detects automatically changes in the ESXi servers (hosts) and logs them into a tamperproof, immutable database. It allows tracking of every change using the detailed dashboard view. Moreover, it allows to set up of rules and alerts and generates audit reports on demand, so companies can answer audit questions about changes in their infrastructure.
Follow this link to learn how ACM can help you monitor your VMware infrastructure. You can request a 30 days trial to familiarize yourself with ACM.
Airtable-approach
We use a is a powerful data analysis tool one can use to analyze large datasets, such as the dimensions and metrics of a cloud-based virtual infrastructure. Here are a few ways in to use our Airtable approach to analyze the dataset:
- Data visualization: allows users to create interactive visualizations of the data, such as line charts, bar charts, and heat maps. Those can help to quickly identify patterns and trends in the data.
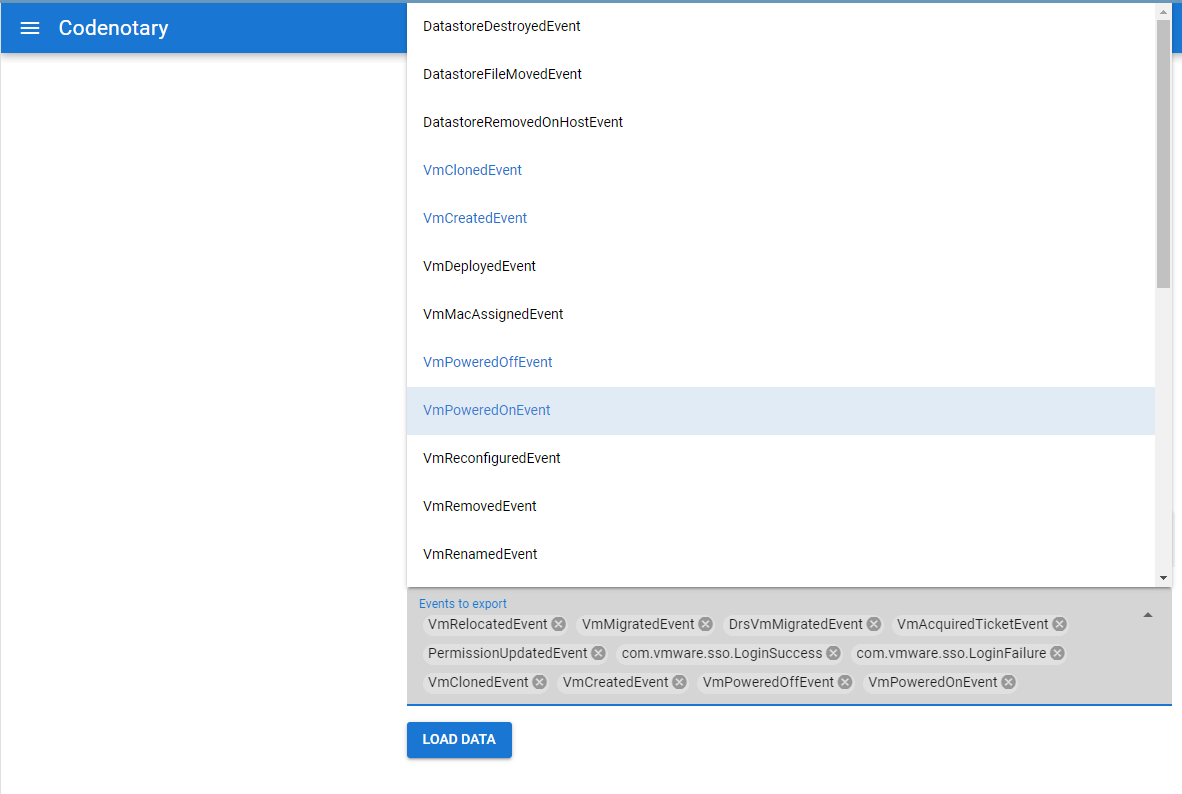
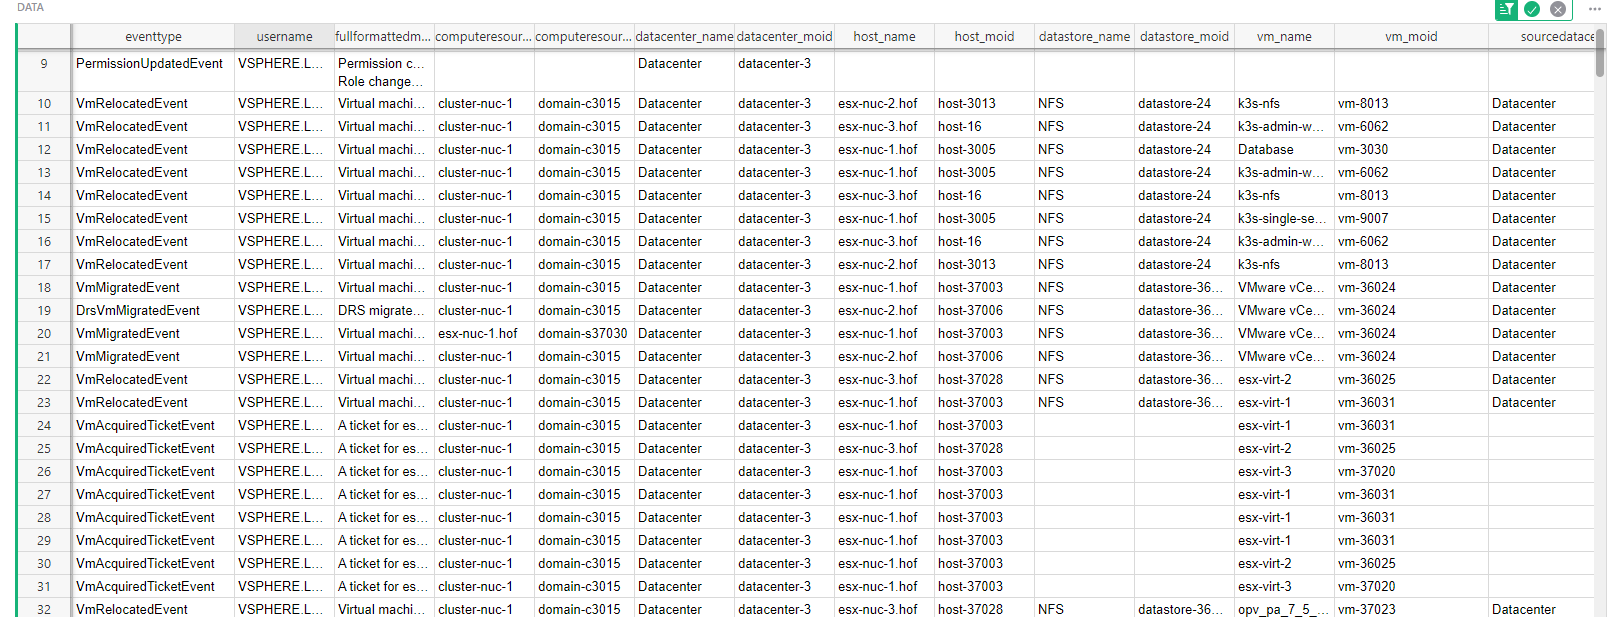
- Querying: provides a flexible query language that allows users to filter and aggregate the data in various ways. Examples would be a virtual machine, ESXi host, or data center. This makes it easy to identify specific subsets of the data that are relevant to a particular analysis.
- Alerting: allows users to set up alerts that trigger when certain conditions are met, such as when CPU usage exceeds a certain threshold. This can help to quickly identify potential issues with the virtual infrastructure.
- Dashboards: provides a dashboard feature that allows users to create custom dashboards that display the data in a way that is relevant to their needs. Users can create a dashboard showing the performance of their virtual machines, or the resource usage of their host servers.
- Time series analysis: allows to perform time series analysis on the data, this allows to identify of trends and patterns in the data over time. This can help to identify performance bottlenecks or other issues that may be affecting the virtual infrastructure.
You could use these insights to make informed decisions about how to optimize and manage the infrastructure.
Dashboards examples
Given the dataset described above, there are several dashboards that can be used or created to efficiently monitor cloud-based virtual infrastructure:
- Virtual Machine Performance Dashboard. This dashboard could display metrics such as CPU usage, memory usage, disk I/O, and network usage for each virtual machine. It could also show the status of the virtual machine, such as whether it is powered on or off, and whether it has any snapshots or backups.
- Host Server Resource Usage Dashboard. This dashboard could display metrics such as CPU usage, memory usage, and storage usage for each host server. It could also show the status of the host server, such as whether it is online or offline, and whether it has any virtual machines running on it.
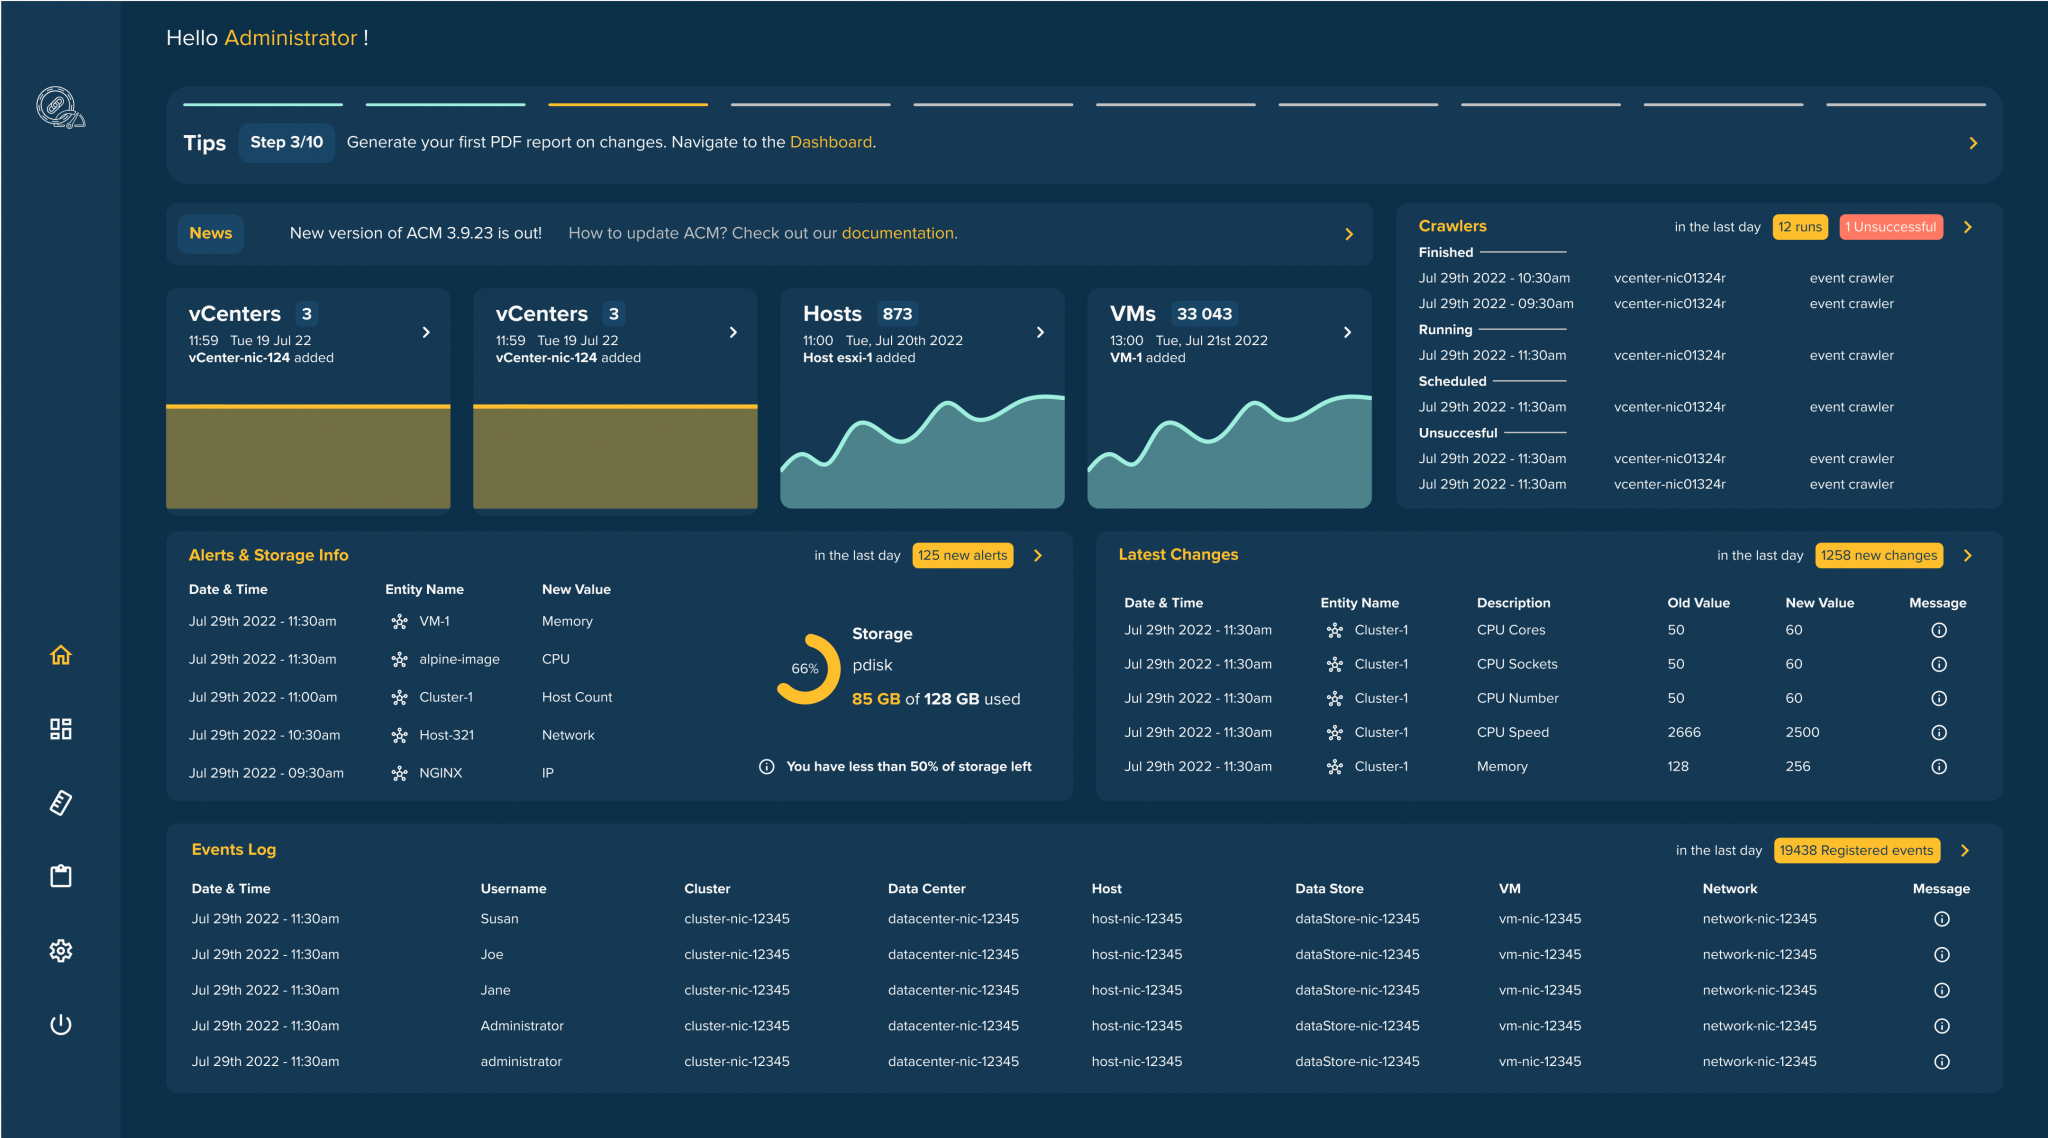
- Datacenter Overview Dashboard. This dashboard could provide an overview of the entire data center, showing the total number of virtual machines, host servers, and storage resources. It could also show the total resource usage, such as CPU and memory usage, and the number of virtual machines in each resource pool or cluster.
- Configuration Change Dashboard. This dashboard could display the history of configuration changes made to virtual machines, host servers, and other components of the infrastructure, as well as the impact that these changes had on performance. It could also show the number of configuration drifts, which are differences between the current configuration and the desired configuration.
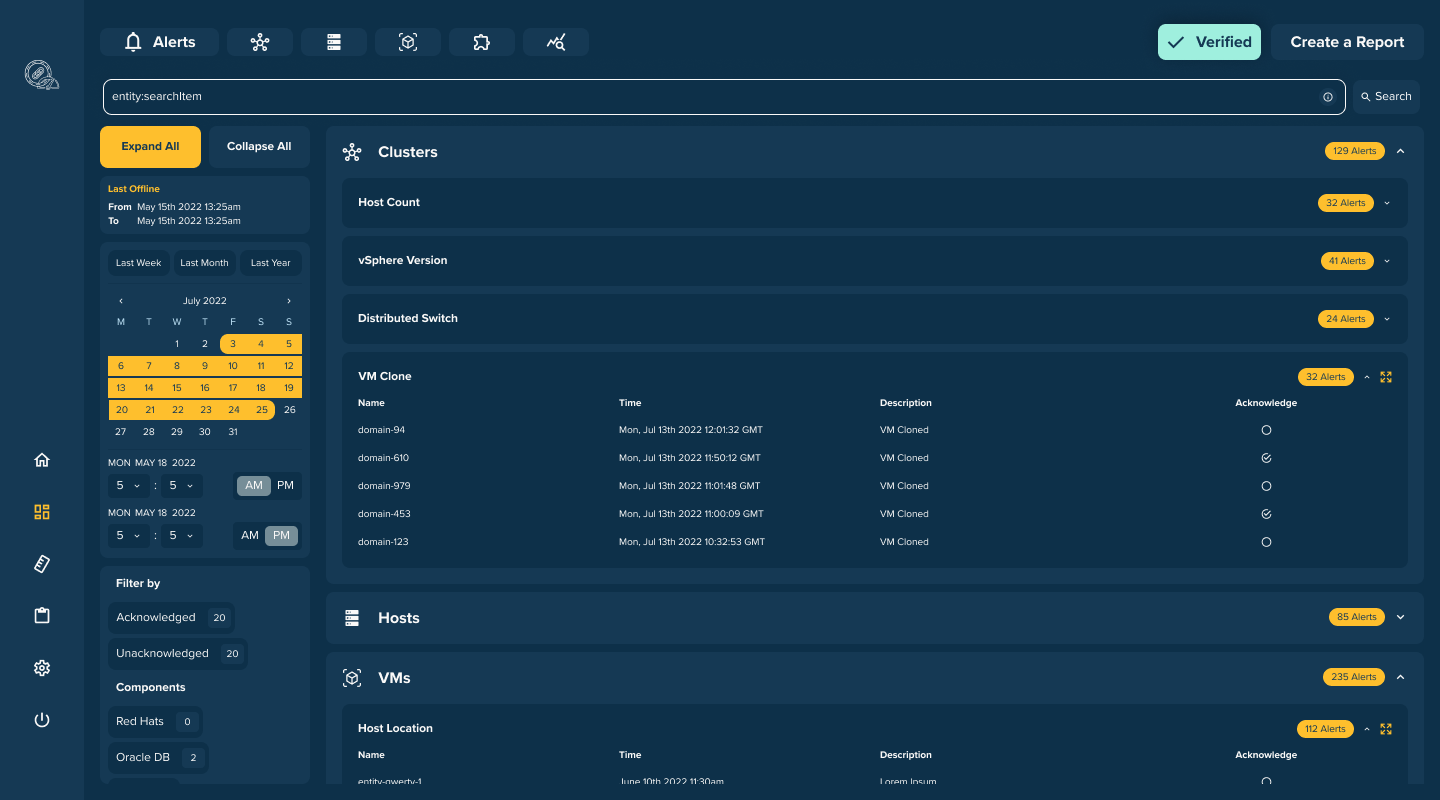
- Alerts Dashboard. This dashboard displays alerts that trigger when certain conditions occur, such as high CPU usage or low disk space. It also shows the status of each alert, whether it is acknowledged, resolved, or still active.
Summary
This article describes an infrastructure monitoring management system for inventory and configuration of cloud-based virtual infrastructure, such as VMware. The system should allow users to view and understand their current configurations and track changes that may impact performance.
The article also lists the dimensions and metrics of data required to create custom dashboards to gain insights into the infrastructure. Additionally, the article suggests different types of reports that could be created in using the airtable-approach to efficiently monitor cloud-based virtual infrastructure.