ESXi is the bare-metal hypervisor and the main component of VMware vSphere that is responsible to run Virtual Machines (VMs) on top of it. ESXi abstracts the underlying hardware resources from the physical server and allocates them to VMs to run workloads and applications. In ESXi hosts, everything is managed by VMKernel which decouples the underlying resources from the physical host, and allocates them to installed VMs.
When the ESXi hypervisor is installed on a compatible physical server, by default it allocates resources to installed VMs, and if workloads increase in an ESXi host, the resources will be overcommitted which means resource allocation to workloads exceeds capacity. This issue can be managed through Shares (allow to prioritize VMs to claim resources), Reservations (define a guaranteed minimum amount of resource allocated to a VM by ESXi host), and Limits (define a max amount of resource allocated to a VM by ESXi host).
When the workload is increased on the ESXi host, it can compromise the performance of the ESXi host due to several factors such as the heavy consumption of resources by certain VMs, applications, and workloads. If this happens, other VMs cannot get access to required physical resources when they need them, and this can badly affect the workload performance on other VMs. To improve the performance of ESXi hosts in your virtual infrastructure, you need to track the resource consumption of a VM from time to time and make sure that the VMs are right-sized with available resources. In this article, we’ll discuss some memory metrics that help in tracking the performance of ESXi hosts in your virtual environment.
Memory Metrics
We all know that VMs on the ESXi hosts are bound to share the underlying physical resources of the host, and as with CPU, memory is also a leading resource-contention factor in virtual environments. In VMware vSphere environment, three layers of memory such as host physical memory (available memory to ESXi hosts), guest physical memory (available memory to OS installed on VMs), and guest virtual memory (available memory at the application level of a VM) exist.
Each VM that is installed on an ESXi host is configured with its host physical memory that can be accessed by the guest OS and can be different in size from how much is allocated to it which depends on the requirements of the VM along with any configured shares, limits, or reservations. When a VM starts, the ESXi host creates memory addresses that are presented to that particular VM, and when an application or workload runs on a VM, it attempts to read/write from the memory page, and the guest OS of the VM translates between guest allocated virtual memory and guest physical memory like it in a non-virtualized environment.
To monitor all of this, it is pretty important to track memory metrics and Opvizor can do this pretty well for you with an easy-to-use UI. In this post, we’ll try to cover some ESXi memory metrics that allow monitoring of the memory usage, performance, and capacity of your virtual infrastructure.
Memory Usage
One of the important metrics of ESXi is memory usage which measures the percentage of configured memory that is being actively used at the VM level. A VM should ideally spare some configured memory, and if it is constantly using all of its configured memory, the ESXi host will not allocate additional memory to the VM, and that VM will become less resilient to any spikes in memory usage. If it happens during monitoring, you should reconfigure the memory size, and update memory allocation settings such as share, limit, reservation, etc.
At the ESXi host level, memory usage is represented in the percentage of the physical memory of an ESXi host that is being consumed, and if it is constantly high, it may not be provisioned to configured VMs that need the memory, and memory ballooning will be run more often.
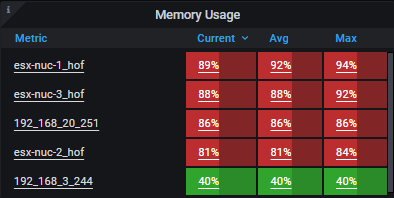
Opvizor monitors the memory usage, memory ballooning, and memory swapping of ESXi hosts in the VMware vSphere environment.
Memory Swap Usage
When a VM is provisioned by an ESXi host, physical disk storage files called swap files are also allocated, and the size of a swap file is determined by the configured size of the VM. If we have a VM configured with 4 GB of memory and has a 2 GB reservation, it has a 2 GB swap file, and by default, swap files of VMs are collocated with their virtual disks on shared storage.
If the physical memory of the ESXi host is running low and memory ballooning is not reclaiming an adequate memory to meet the requirements quickly enough, the ESXi host will start using swap space to read/write data, and the process is known as memory swapping. A VM can be slow down when reading/writing data to disk takes place and it normally takes a longer time than using memory, and if this happens, memory swapping will take place.
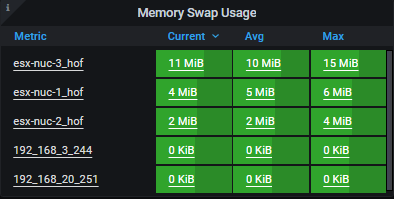
Opvizor is one of the best VMware vSphere monitoring solutions available in the market that run within minutes into your virtual infrastructure and start monitoring the ESXi memory and other important metrics.
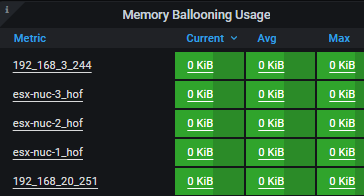
Memory Ballooning Usage
Memory ballooning is a memory reclamation method in VMware vSphere-based environment that allows ESXi host to reclaim unused memory from configured VMs on top of it, and if any VM experiences a shortage in memory, it can be reclaimed to run the application.
Each VM in VMware vSphere environment has a balloon driver installed on it, and if an ESXi host faces a low memory issue, it can reclaim the memory from the guest physical memory of VMs. For this purpose, the request is sent to the balloon driver of the VM as the ESXi host doesn’t have any knowledge about memory that is not being used by any VM, and memory is taken from the balloon driver by the ESXi host, deallocate it from host physical memory, and reallocate it to other VMs that required it.
Conclusion
To improve the performance of ESXi hosts in your virtual infrastructure, you need to monitor the memory metrics of your ESXi hosts. Memory metrics of ESXi hosts and configured VMs are very important to track along with other metrics.
Opvizor is a software that helps VMware admins to track and monitor important ESXi metrics including memory metrics such as memory usage and swapping and runs in minutes to identify the issues that can degrade the performance of your VMware-based virtual environment.