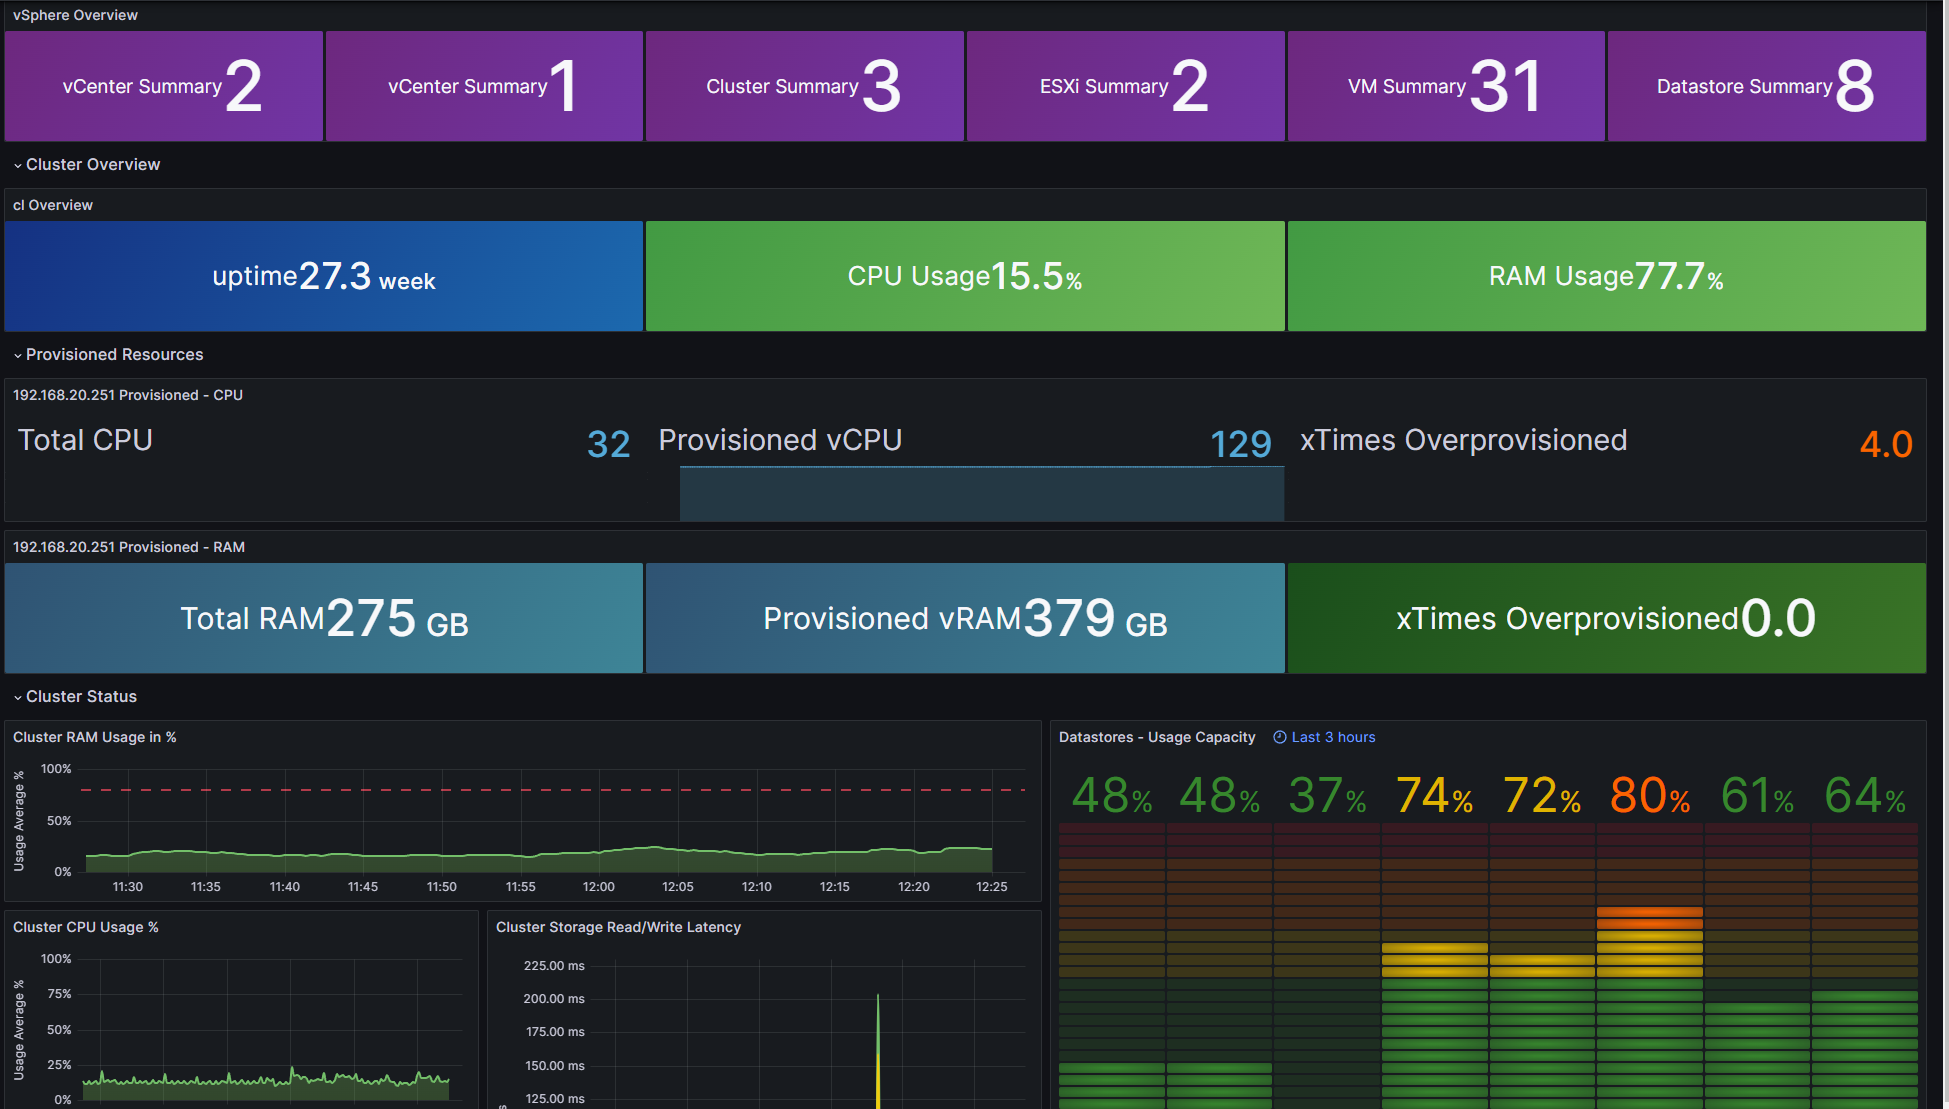
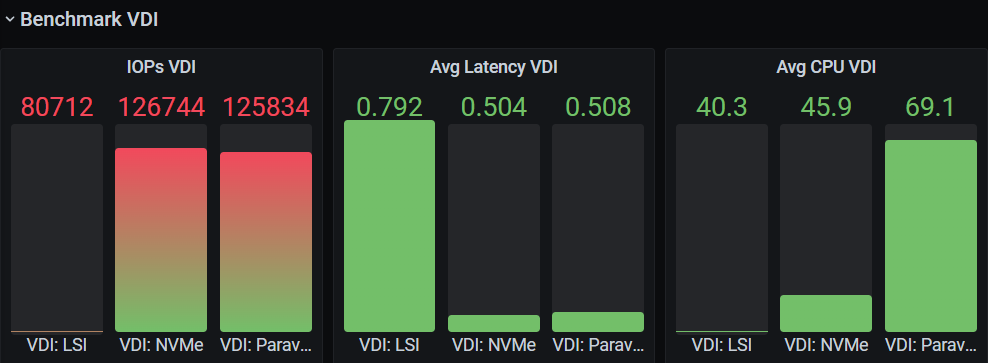
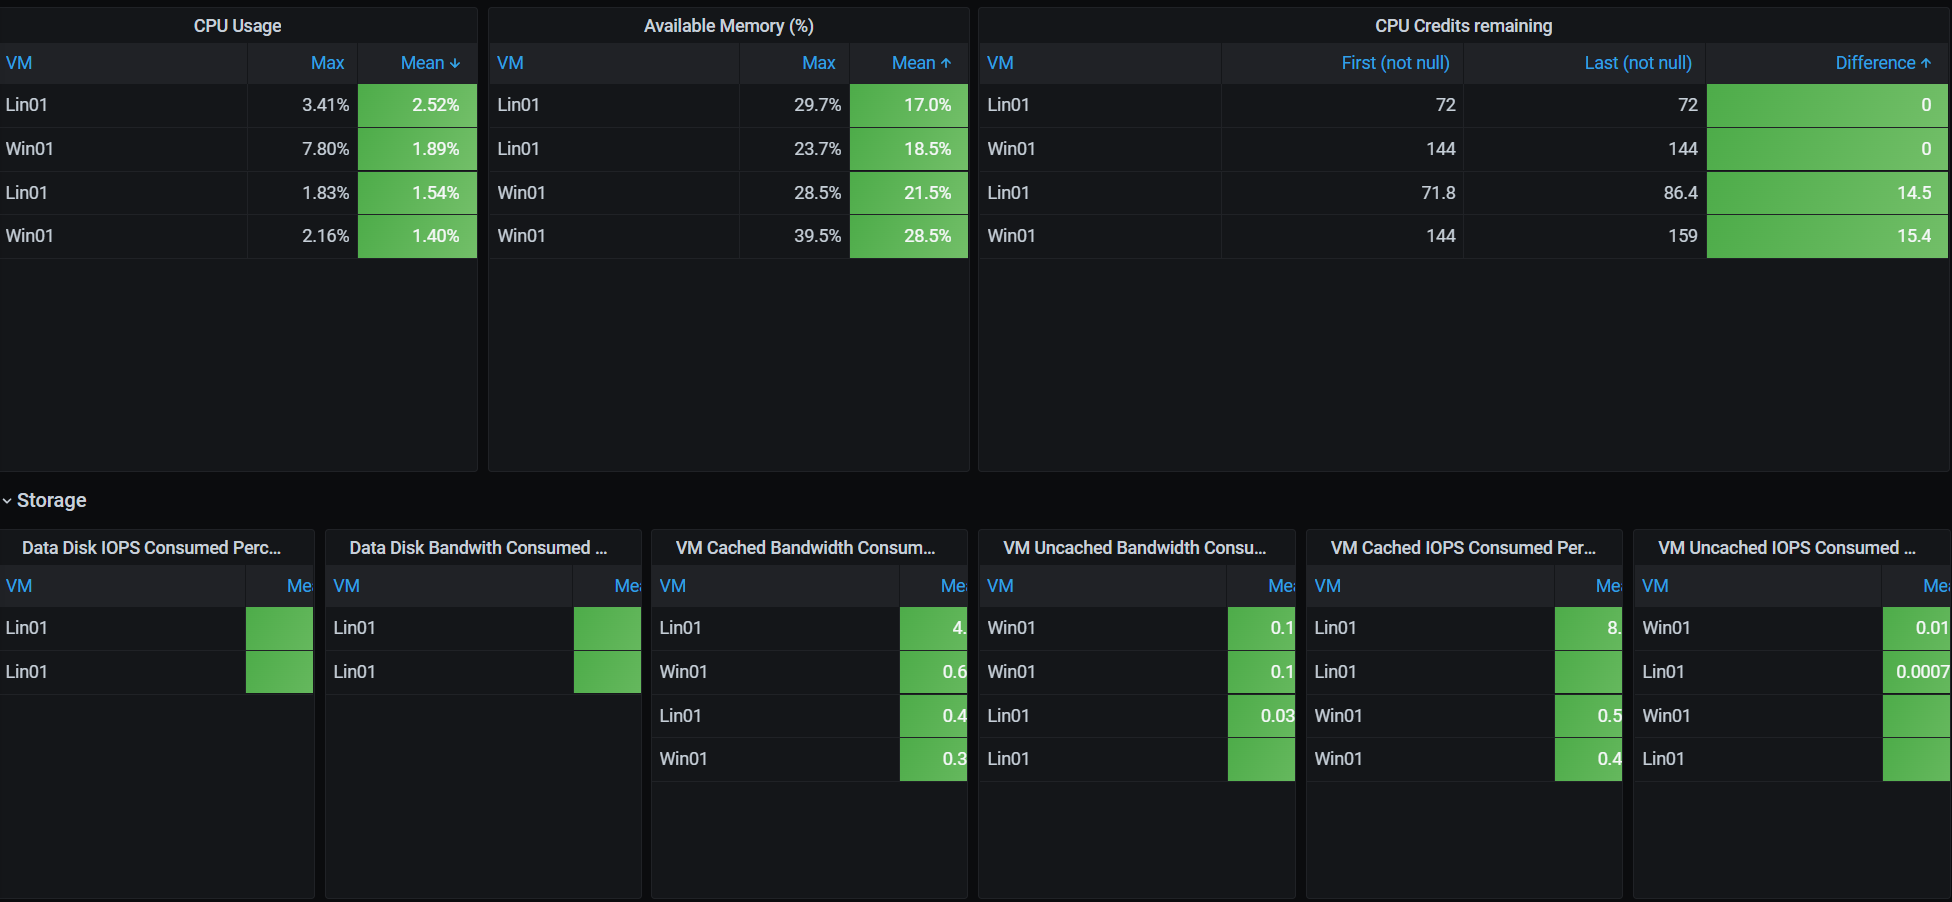
All your VMware, AWS and Azure metrics and logs monitored in one place
Never miss a performance bottleneck, filled up disk or dropped network package again. Know your operational risk of Hosts and Virtual Machines in your multi-cloud environments.
Posts by Tag
- Metrics and Logs (39)
- VM Performance (9)
- VMware (7)
- Opvizor (6)
- performance (5)
- General (4)
- cloud (4)
- proxmox (4)
- AI (3)
- chatgpt (3)
- linux (3)
- Tanzu (2)
- VDI (2)
- VM configuration (2)
- AWS (1)
- Auditable Change Management (1)
- REST (1)
- certificates (1)
- container (1)
- database (1)
- esxi (1)
- forecasting (1)
- immudb (1)
- kubernetes (1)
- llm (1)
- scripting (1)
- virtual machine (1)
- vulnerability (1)
Guardians of software™
Our mission is to protect the software supply chain using advanced AI technologies, while delivering customer-specific business outcomes through a world-class experience. We leverage the full capabilities of our applications to ensure our customers not only stay secure, but also achieve measurable value and resilience across their digital ecosystems.
6300 W Loop S Suite 240,
Bellaire, TX 77401, United States
Product
Resources

.png)


